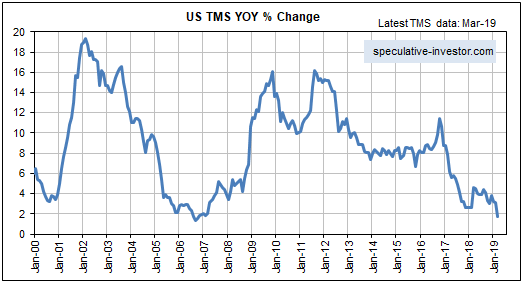
A popular view is that the Fed has given up on monetary tightening and as a result the stock market should continue to trend upward over the months ahead. This view is based on flawed reasoning.
The reality is that the Fed possibly will give up on monetary tightening later this year, but currently the Fed is pulling quite firmly on the monetary reins via its on-going balance-sheet normalisation (that is, balance-sheet reduction) program. Moreover, the Fed’s on-going withdrawal of money from the economy is not being fully offset by the actions of the commercial banks, so the overall US money-supply situation is becoming increasingly restrictive. This is evidenced by the following chart of the year-over-year (YOY) change in US True Money Supply (TMS). The chart shows that in March-2019 the US monetary inflation rate made a 12-year low.

However, the unusually slow pace of US money-supply growth is not a good reason to be short-term bearish on the US stock market. This is partly because changes in the financial markets lag changes in the monetary backdrop by long and variable amounts of time. It is also because of a point that was covered in a TSI blog post about three weeks ago.
The point I’m referring to is that whether the overall monetary situation is ‘tightening’ or ‘loosening’ is not solely determined by the change in money supply. Instead, over periods of up to a few years the change in the demand for money (meaning: the change in the desire to hold/obtain cash as an asset) often will dominate the change in the supply of money.
In general terms, the change in overall liquidity is determined by the change in the supply of money relative to the change in the demand to hold cash or cash-like securities. As a consequence, it’s possible for the liquidity situation to be tight even if the monetary inflation rate is very high and/or rapidly increasing. A great example is the period from September-2008 to March-2009, when a large and fast increase in the US money supply was more than offset by a surge in the demand for money. Also, it’s possible for there to be abundant liquidity even if the monetary inflation rate is very low. A good example occurred over the past 3-4 months.
Although the supply side of the monetary equation tends to be dominated by the demand side of the equation over the short-to-intermediate-term, today’s unusually low monetary inflation rate is still significant. It means that only a small increase in the demand to hold cash could bring about another plunge in the stock market. To put it another way, due to the low monetary inflation rate the US stock market is far more vulnerable than usual to a short-term increase in risk aversion.
Taking a wider-angle view, the money-supply situation also leads to the conclusion that if a bear market did not begin last year (it most likely didn’t) then it will begin by the second half of next year at the latest. Other indicators will be required to narrow-down the timing.
 Print This Post
