In a few previous blog posts (for example, HERE) I discussed the limitations of sentiment as a market timing tool. It certainly can be helpful to track the public’s sentiment and use it as a contrary indicator, and some of my most successful trades have been partly based on sentiment extremes. However, these days I place less weight on sentiment than I did in the past.
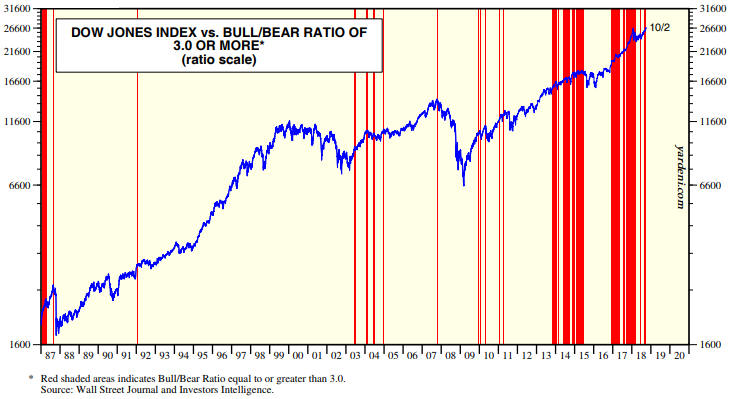
As mentioned in earlier posts, there is no better example of sentiment’s limitations as a market timing tool than the US stock market’s performance over the past few years. This is evidenced by the following chart from Yardeni.com. The chart shows the performance of the Dow Jones Industrials Index over the past 31 years with vertical red lines to indicate the weeks when the Investors Intelligence (II) Bull/Bear ratio was at least 3.0 (a bull/bear ratio of 3 or more suggests extreme optimism within the surveyed group).
Notice that while vertical red lines (indicating extreme optimism) coincided with some important price tops, there were plenty of times when a vertical red line did not coincide with an important price top. Also, notice that with the exception of a multi-quarter period during 2015-2016 when the market was in correction mode, optimism has been extreme almost continuously since Q4-2013.
In effect, sentiment has been consistent with a bull market top for the bulk of the past five years, but there is still no evidence in the price action that the bull market has ended. On the contrary, while there is a high risk of a significant correction in the short term, the long-term leading indicators I track point to the bull market extending well into 2019.
Regardless of what happens from here, five years is a long time for a contrarian to be wrong.
 Print This Post

