Print This Post Print This Post

Can silver rally without gold?

June 29, 2018

[This blog post is an excerpt from a recent TSI commentary]

The article titled “Silver’s Critical Role In Electrification May Fuel Its Rise” contains some interesting comments about the silver market, but with one minor exception the information presented in this article has no bearing on silver’s risk/reward as a speculation or investment. The minor exception is the high (by historical standards) gold/silver ratio, which suggests that the silver price is likely to rise relative to the gold price over the next few years. However, none of the information about silver ‘fundamentals’ presented in the article is relevant to the silver price.

It isn’t relevant for the same reasons that most of the information presented by the ‘experts’ about gold fundamentals is also not relevant: It treats the annual output of the mining sector as if it were the total supply (annual mine production is a small fraction of the total supply) and it confuses flows from one part of the market to another with changes in total demand (every ‘flow’ involves an increase in demand on the part of the buyer and an exactly offsetting decrease in demand on the part of the seller). Furthermore, it isn’t relevant for another reason that can be illuminated by asking the question: within the past 80 years, when was there a major silver rally in the absence of a gold rally?

The answer is that over the past 80 years there hasn’t been a single major silver rally in the absence of a gold rally. The best rally in silver without a concurrent rally in gold was the 6-month price spike that began in Q3-1997. This rally resulted from an attempt to manipulate the price upward on the back of Warren Buffett’s silver accumulation; it did not result from any of the ‘fundamental’ drivers cited by commentators trying to make the case that silver can rally strongly without gold.

The historical record persuasively argues that large silver rallies don’t happen in the absence of large gold rallies. This tells us that either economic/financial-system confidence drives the silver market in the same way that it drives the gold market or that the big trends in silver simply follow the big trends in gold.

The bottom line is that there does not appear to be a good reason to expect the silver price to move substantially higher independently of the gold price.

Print This Post Print This Post

Why the yield curve changes direction ahead of a recession

June 18, 2018

[This post is an excerpt from a TSI commentary]

Conventional wisdom is that an inversion of the yield curve (short-term interest rates moving above long-term interest rates) signals that a recession is coming, but this is only true to the extent that a recession is always coming. A reversal in the yield curve from flattening to steepening is a far more useful signal.

What a yield curve inversion actually means is that the interest-rate situation has become extreme, but there is no telling how extreme it will become before the eventual breaking point is reached. Furthermore, although there was a yield-curve inversion prior to at least the past seven US recessions, Japan’s most recent recessions were not preceded by inverted yield curves and there is no guarantee that short-term interest rates will rise by enough relative to long-term interest rates to cause the yield curve to become inverted prior to the next US recession. In fact, a good argument can be made that due to the extraordinary monetary policy of the past several years the start of the next US recession will NOT be preceded by a yield curve inversion.

Previous US yield curve inversions have happened up to 18 months prior to the start of a recession, and as mentioned above it’s possible that there will be no yield curve inversion before the next recession. Therefore, we wouldn’t want to be depending on a yield curve inversion for a timely warning about the next recession or financial crisis. However, the yield curve can provide us with a much better, albeit still imperfect, recession/crisis warning in the form of a confirmed trend reversal from flattening to steepening. This was discussed in numerous TSI commentaries over the years and was also covered in a blog post last December.

There are two reasons that a reversal in the yield curve from flattening to steepening is a more useful recession/crisis warning signal. First, it is timelier. Second, it should work regardless of whether or not the yield curve becomes inverted.

Now, from a practical speculation standpoint it is not essential to understand WHY the yield curve reverses from flattening to steepening ahead of major economic problems bubbling to the surface. It is enough to know that it does. However, if you understand why the curve has reversed direction ahead of previous recessions you will understand why it either should or might not reverse direction in a timely manner in the future. After all, if extraordinary monetary policy could prevent the yield curve from becoming inverted ahead of the next recession then perhaps it also could prevent the yield curve from reversing course the way it has in the past.

With regard to understanding the why, the first point to grasp is that the boom phase of the cycle is characterised by borrowing short-term to lend/invest long-term. This puts upward pressure on short-term interest rates relative to long-term interest rates, meaning that it causes the yield curve to flatten. Also, when the boom is mature and is approaching its end there will be a scramble for additional short-term financing to a) complete projects that were started when monetary conditions were easier and b) address cash shortages that have arisen due to completed projects not delivering the predicted cash flows. This puts further upward pressure on short-term rates relative to long-term rates, and could, although won’t necessarily, cause the yield curve to become inverted.

Next, as the boom nears its end the quantity of loan defaults will begin to rise and the opportunities to profit from short-term leverage will become scarcer. Everything will still seem fine to casual observers, central bankers, the average economist and the vast majority of commentators on the financial markets, but it will now be apparent to a critical mass of astute operators (investors, speculators and financiers) that many of the investments that were incentivised by years of easy money were ill-conceived. These operators will begin shifting towards ‘liquidity’ and away from risk.

The aforementioned increasing desire for the combination of safety and liquidity leads to greater demand for cash and gold. But more importantly as far as this discussion is concerned, it boosts the demand for short-term Treasury debt relative to long-term Treasury debt (thus putting downward pressure on short-term interest rates relative to long-term interest rates). The reason is that the shorter the term of the Treasury debt, the lower the risk of an adverse price movement. For example, if you lend $10B to the US government via the purchase of 3-month T-Bills then in three months’ time you will have something worth $10B, but if you lend $10B to the US government via the purchase of 10-year T-Notes then in three months’ time you could have something that is worth significantly more or less than $10B.

As an aside, what an investor focused on boosting liquidity really wants is cash, but if he has billions of dollars then cash is not a viable option. This is because the cash would have to be deposited in a bank, which means that the investor would be lending the money to a bank and taking the risk of a massive loss due to bank failure. Lending to the US government is a much safer choice.

In summary, it’s mainly the desire for greater liquidity and safety that begins to emerge at the tail-end of a boom that causes the yield curve to stop flattening and start steepening. As demonstrated by the events of the past few years the central bank has substantial power to postpone the end of a boom, but eventually a breaking point will be reached and when it is the yield curve’s trend will change from flattening to steepening.

Print This Post Print This Post

What is fiat currency?

June 11, 2018

The term “fiat” is often associated with irredeemable-paper or electronic currency, but existing only in paper or electronic form is not the defining characteristic of fiat currency. In fact, paper or electronic currency is not necessarily “fiat” and hard commodity currency can be “fiat”.

Regardless of the form it takes, fiat currency is simply currency by government decree. If the government dictates that a certain ‘thing’ is money and must be accepted in payment for goods, services and debts, then that ‘thing’ is a fiat currency.

Obviously, all of today’s national currencies are fiat currencies. Not so obviously, gold was a fiat currency during the Gold Standard era. It could be claimed — without any argument from me — that during the Gold Standard era gold would have been the most widely used currency without the government making it so, but this is beside the point. In the situation where the government has commanded that gold is money, gold is a fiat currency.

Also not so obviously considering what has been written on the topic in other places, Bitcoin is not a fiat currency. If anything it is the opposite of a fiat currency, because it was created by the private sector and is not supported in any way by the government. This doesn’t mean that Bitcoin is a good currency, as there is a lot more to being a good currency than being outside the direct control of government.

Summing up, people should be careful when applying the word “fiat” to currency/money. The word is routinely used to mean irredeemable or non-physical, but that’s not what it actually means.

Print This Post Print This Post

The useless and dangerous “money velocity” concept

June 5, 2018

In a blog post about three years ago I explained that in the real world there is money supply and there is money demand; there is no such thing as money velocity. “Money velocity” only exists in academia and is not a useful economics concept. In this post I’ll try to make the additional point that in addition to being useless, it can be dangerous.

Before getting to why the money velocity concept can be dangerous, it’s worth quickly reviewing why it is useless. In this vein, here are the main points from the blog post linked above:

1) The price (purchasing power) of money is determined in the same way as the price of anything else: by the interplay of supply and demand. The difference is that money is on one side of almost every transaction, so at any given time there will be millions of different prices for money. This is why it makes no sense to come up with a single number (e.g. the CPI) to represent the purchasing power of money.

2) Money velocity, or “V”, comes from the Equation of Exchange. This equation is often expressed as M*V = P*Q, or, in more simple terms, as M*V = nominal GDP, where “M” is the money supply. In essence, “V” is a fudge factor that is whatever it needs to be to make one side of the ultra-simplistic and largely meaningless Equation of Exchange equal to the other side.

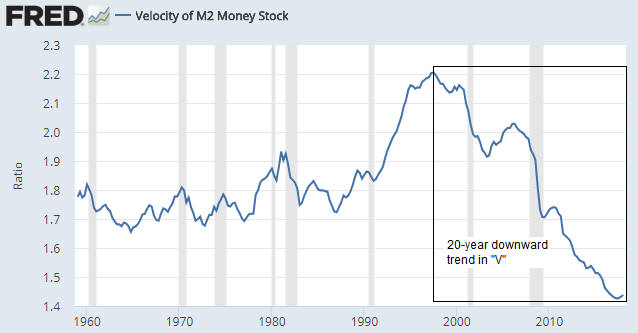
3) The Equation of Exchange can be written: V = GDP/M. Consequently, whenever you see a chart of “money velocity” what you are really seeing is a chart showing nominal GDP divided by some measure of money supply. During a long period of relatively fast monetary inflation the line on such a chart naturally will have a downward slope.

4) Over the past two decades the pace of US money-supply growth has been relatively fast. Hence the downward trend in the GDP/M ratio (a.k.a. money velocity) over this period. Refer to the following chart for details.

5) During the 2-decade period of declining “V” there were multiple economic booms and busts, not one of which was predicted by or reliably indicated by “V”.

velocity_040618

That’s why “money velocity” is useless in describing/analysing how the world works. Unfortunately, there are many influential economists who believe that the simplistic Equation of Exchange can be put to good use when figuring out what’s happening in the world of human action and what should be done about it. These economists, some of whom are in senior positions at central banks, view “money velocity” not only as a valid real-world concept, but also as an important causal factor in the economy.

If you believe that changes in “V” cause changes in economic growth, with a higher “V” bringing about faster growth, then during periods of economic weakness you will be in favour of policies that are specifically designed to boost “V”. In particular, you will be in favour of policies that result in or promote faster spending for the sake of spending.

Of course, if the supply of money is constant then the calculated value of “V” will be high during periods of strong growth and low during periods of weak or no growth. However, the cause is the growth and the change in “V” is a calculated effect of the growth.

Thinking that growth can be boosted via policies designed to increase “V” is similar to the mistake made by Herbert Hoover during the first few years of the Great Depression. He knew that prices tended to rise during economic booms and fall during economic depressions, so he concluded that a depression could be avoided if prices were prevented from falling. That is, he confused cause and effect. This led to efforts to prop-up prices, especially the price of labour. Not surprisingly, these efforts were counter-productive.

Summing up, the belief that “money velocity” is a useful real-world concept is not only wrong, but also dangerous if it is held by people with the power to influence central-bank or government policy.

Print This Post Print This Post