[This blog post is an excerpt from a recent TSI commentary]
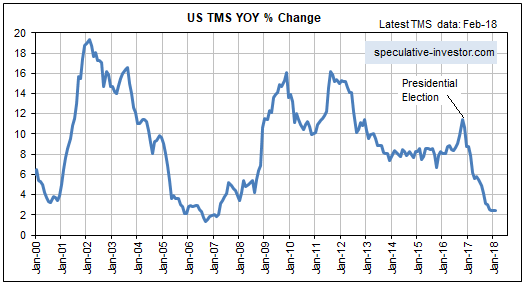
The year-over-year rate of growth in the US True Money Supply (TMS) was around 11.5% in October of 2016 (the month before the US Presidential election) and is now only 2.4%, which is near a 20-year low. Refer to the following monthly chart for details. In terms of effects on the financial markets and the economy, up until recently the US monetary inflation slowdown was largely offset by continuing rapid monetary inflation elsewhere, most notably in Europe. However, the tightening of US monetary conditions has started to have noticeable effects and these effects should become more pronounced as the year progresses.

The tightening of monetary conditions eventually will expose the mal-investments of the last several years, which, in turn, will result in a severe recession, but the most obvious effect to date is the increase in interest rates across the entire curve. The upward acceleration in interest rates over the past six months has more than one driver, but it probably wouldn’t have happened if money had remained as plentiful as it was two years ago.
It would be a mistake to think that the tightening has been engineered by the Fed. The reality is that the Fed has done very little to date.
The Fed has made several 0.25% increases in its targeted interest rates, but the main effect of these rate hikes is to increase the amount of money the Fed pays to the commercial banks in the form of interest on reserves (IOR). It doesn’t matter how you spin it, injecting more money into banks ain’t monetary tightening!
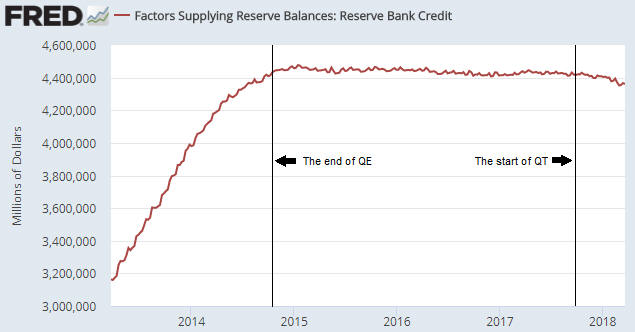
The Fed’s actual efforts on the monetary loosening/tightening front over the past 5 years are encapsulated by the following weekly chart of Reserve Bank Credit (RBC). This chart shows that there was a rapid rise in RBC during 2013-2014 that ended with the completion of QE in October-2014. For the next three years RBC essentially flat-lined, which is what should be expected given that the Fed was neither quantitatively easing nor quantitatively tightening during this period. In October-2017 the Fed introduced its Quantitative Tightening (QT) program. To date, this program has resulted in only a small reduction in RBC, but the plan is for the pace of the QT to ramp up.
Strangely, the most senior members of the Fed appear to believe that their baby-step rate hikes constitute genuine tightening and that the contraction of the central bank’s balance sheet is neither here nor there. The reality is the opposite.

So, the Fed is not responsible for the large decline in the US monetary inflation rate and the resultant tightening of monetary conditions that has occurred to date.
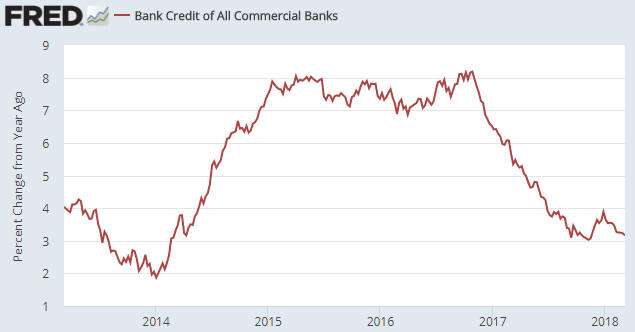
The responsibility for the tightening actually lies with the commercial banks. As illustrated by the next chart, the year-over-year rate of growth in commercial bank credit was slightly above 8% at around the time of the Presidential election in late-2016 and is now about 3%.

We won’t be surprised if a steepening yield curve prompts commercial banks to collectively increase their pace of credit creation over the next two quarters, but with the Fed set to quicken the pace of its QT the US monetary inflation rate probably will remain low by the standards of the past two decades. At the same time, the ECB will be taking actions that reduce the monetary inflation rate in the euro-zone. This could lead to stock and bond market volatility during the second half of this year that dwarfs what we’ve witnessed over the past two months.
 Print This Post
