[This post is a brief excerpt from a TSI commentary published a week ago]
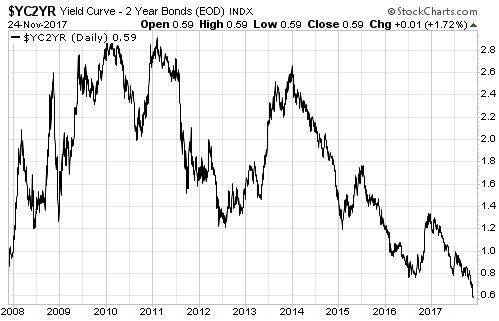
The US economic boom is still in progress, where a boom is defined as a period during which monetary inflation and the suppression of interest rates create the false impression of a growing/healthy economy*. We know that it is still in progress because the gap between 10-year and 2-year Treasury yields — our favourite proxy for the US yield curve — continues to shrink and is now the narrowest it has been in 10 years.

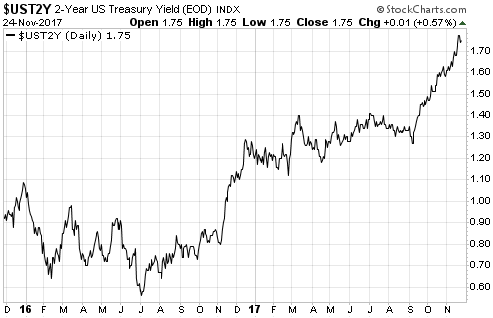
Reiterating an explanation we’ve provided numerous times in the past, an important characteristic of a boom is an increasing desire to borrow short to lend/invest long. This puts upward pressure on short-term interest rates relative to long-term interest rates, which is why economic booms are associated with flattening yield curves. The following chart shows the accelerating upward trend in the US 2-year yield that was the driving force behind the recent sharp reduction in the 10yr-2yr yield spread.

The above paragraph explains why a yield-curve trend reversal from flattening to steepening invariably occurs around the time of a shift from economic boom to economic bust. Such a reversal is a sign that the willingness and/or ability to take on additional short-term debt to support investments in stocks, real estate, factors of production and long-term bonds has diminished beyond a critical level. From that point forward, a new self-reinforcing trend involving debt reduction and the liquidation of investments becomes increasingly dominant.
The recent performance of the yield curve indicates that the US economy hasn’t yet begun the transition from boom to bust.
*The remnants of capitalism enable some genuine progress to be made during the boom phase, but the bulk of the apparent economic vibrancy is associated with monetary-inflation-fueled price rises and activities that essentially consume the ‘seed corn’.
 Print This Post
