[This post is a modified excerpt from a recent TSI commentary]
In a 12th June blog post I revisited the potential pitfalls in using sentiment as a market timing tool. As an example of a pitfall, the post included a chart of the Investors Intelligence (II) bull/bear ratio suggesting that US stock market sentiment had been consistent with a bull-market top for the bulk of the past four years. Even though the chart helped to make my point it is appropriate to question how sentiment, when used as a contrary indicator, could be so wrong for so long.
I’ve come up with a possible explanation for why measures of US stock-market sentiment that worked well as contrary indicators in the past have not been useful of late. The reason relates to the third of the potential pitfalls outlined in the above-linked blog post. Specifically:
“…regardless of what sentiment surveys say, there will always be a lot of bears and a lot of bulls in any financial market. It must be this way otherwise there would be no trading and the market would cease to function. As a consequence, if a survey shows that almost all traders are bullish or that almost all traders are bearish then the survey must be dealing with only a small — and possibly not representative — segment of the overall market.”
The explanation I’ve come up with is that prior to the past few years the II sentiment survey, which is a survey of investment advisors who regularly publish their views via newsletters, reflected the sentiment of the investing public, but this is not so much the case anymore. Prior to the past few years the advisors and the general public would become increasingly bullish or increasingly bearish together, with high levels of optimism invariably following persistent price strength and high levels of pessimism invariably following either persistent or dramatic price weakness. Over the past few years, however, the perceptions of these two groups took separate paths. Investment advisors became very optimistic in reaction to the strong upward trend in prices, but for the most part the general public remained unenthusiastic about the stock market.
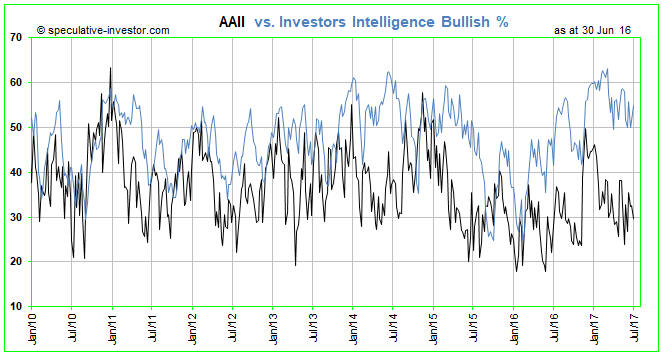
The change described above can be illustrated by comparing the II bullish percentage with the AAII (American Association of Individual Investors) bullish percentage, which has been done on the chart displayed below. The AAII survey is based on the opinions of retail investors, that is, the general public.
The chart shows that prior to 2014 the II (the blue line) and AAII (the black line) bullish percentages typically moved up and down together within a similar range, but that from 2014 onward the II bullish percentage tended to be significantly higher. Furthermore, the distance between the two survey results has increased since early this year, with the II bullish percentage remaining above 50 and the AAII bullish percentage spending most of its time in the 25-35 range. The most recent results show an II bullish percent of 54.9 and an AAII bullish percent of 29.7.
It seems that the general public’s stock-market sentiment has not reached an optimistic extreme during the current cycle. Does this mean that there’s a lot more price strength to come or does it mean that the next major price top will happen without the general public having fully embraced the upward trend?
I don’t know, but it’s definitely possible that the public will never fully embrace the latest bullish trend for the simple reason that it is financially incapable of doing so. Having had its savings decimated when earlier Fed-fueled investment booms inevitably collapsed it may not have the financial wherewithal to enthusiastically participate in the Fed’s latest bubble-blowing venture.
 Print This Post

