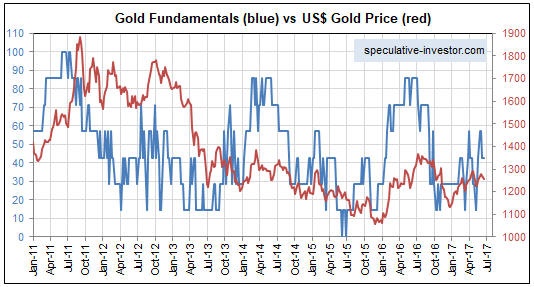
A 23rd June post at the TSI Blog described the model (the Gold True Fundamentals Model – GTFM) that I developed to indicate the extent to which the fundamental backdrop is bullish for gold. The GTFM is an attempt to determine a single number that incorporates the most important fundamental drivers of the gold price, where I define “fundamental driver” as something that happens in the economy or the financial markets that causes a significant change in the desire/urgency to own gold in some form. Keith Weiner subsequently posted an article objecting to some of my “fundamental drivers”, which would be fine except that his article contains several misunderstandings of these price drivers and/or how I am using them. The purpose of this post is to address these misunderstandings and provide a little more information on the GTFM’s components.
1. The ‘Real’ Interest Rate
Keith states: “The Real Interest Rate is the Nominal Interest Rate – inflation.” No, that’s not what the real interest rate is, although many people wrongly calculate it that way.
Keith and I agree that it is not possible to calculate the economy-wide change in money purchasing-power (PP), but even if it were possible to come up with a single number that represented prior “inflation” the real interest rate would not be the nominal interest rate minus this number. The reason, to explain using an example, is that the real return that will be obtained by someone who makes a 12-month investment today in an interest-bearing security will have nothing to do with the change in the PP of money over the preceding 12 months. Instead, the real return that will be obtained by this person will be determined by the change in money PP over the ensuing 12 months.
Now, we can obviously never know in advance what the real return on any interest-bearing security or deposit will be, but since the advent of Treasury Inflation-Protected Securities (TIPS) in 2003 it has been possible to roughly determine the real return on Treasury debt expected by the average bond trader. The TIPS yield, which is based on the EXPECTED rate of currency depreciation, is my ‘real’ interest rate proxy.
If there had been a TIPS market in the 1970s then it would probably be apparent that the large gains made by the gold price during that decade were related to a low/falling real interest rate, where the real interest rate is defined as the nominal interest rate minus the expected rate of currency depreciation. In any case, there has definitely been an inverse correlation between the TIPS yield (10-year or 5-year) and the gold price over the past 10 years. Furthermore, the correlation has strengthened over the past 2 years.
By the way, it’s the DIRECTION, not the value, of the TIPS yield that matters to gold and that is taken into account by the GTFM.
The inverse relationship between the TIPS yield and the gold price is far from perfect, the reason being that there are times when other price drivers are more influential. That’s why the ‘real interest rate’ has only a one-seventh weighting in the GTFM.
2. The Yield Curve
There has never been a strong and consistent short-term correlation between the gold price and the yield curve, but near major turning points the yield curve tends to be the dominant driver.
In broad terms, the boom phase of the central-bank-promoted boom-bust cycle is generally associated with a flattening yield curve and the bust phase is generally associated with a steepening yield curve. Gold generally performs better during the bust phase, when the curve is steepening. Somewhat counterintuitively, banks tend to do best during the long periods of yield-curve flattening. This can be demonstrated empirically and makes sense if you understand how the central-bank-promoted boom-bust cycle works.
A major flattening trend in the US yield curve got underway during the second half of 2011 and continues to this day. This flattening trend is associated with a boom, which, in turn, has temporarily helped the banks and reduced the desire to own gold.
3. Credit Spreads
The trend in credit spreads is one of the best measures of the overall trend in economic confidence, with widening spreads (yields on lower-quality bonds rising relative to yields on higher-quality bonds) being indicative of declining economic confidence. Gold tends to do relatively well during periods when economic confidence is on the decline, that is, during periods when credit spreads are widening. I have demonstrated this in the past using charts.
4. The Relative Strength of the Banking Sector
Keith writes: “We haven’t plotted it, but we assume bank stocks will outperform the broader stock market when the yield curve is steeping by way of falling Fed Funds rate. This is when the banks’ net interest margin is rising, and they are getting capital gains on their bond portfolio too. At the same time, credit spreads are narrowing, so the banks are getting capital gains on their junk bonds.”
No, that’s not how it works. Refer to my yield curve comments above for a very brief explanation.
The banking sector will often fare poorly during major yield-curve steepening trends because a banking crisis is often a primary cause of the steepening trend. In any case, this indicator is based on the concept that the investment demand for gold will be boosted by declining confidence in the banking system and reduced by rising confidence in the banking system.
5. The US Dollar’s Exchange Rate
More often than not, the US$ gold price trends in the opposite direction to the Dollar Index. However, there are times when a crisis outside the US causes both a rise in the US$ on the FX market and a large rise in the US$ gold price. The fact that the inverse correlation between the gold price and the Dollar Index can break down in a big way at times is why the US dollar’s performance on the FX market only has a one-seventh weighting in the GTFM. To put it another way, if the gold price always moved in the opposite direction to the Dollar Index then there would be no reason for gold traders to consider anything except the Dollar Index.
6. The General Trend in Commodity Prices
I have included the general trend in commodity prices as indicated by the S&P GSCI Commodity Index (GNX) in the GTFM for the practical reason that there are times when it tips the balance. That is, there are times when a strong upward trend in commodity prices enables the US$ gold price to rise despite an otherwise slightly-bearish (for gold) fundamental backdrop and there are times when a strong downward trend in commodity prices causes the US$ gold price to fall despite an otherwise slightly-bullish fundamental backdrop.
7. The Bond/Dollar Ratio
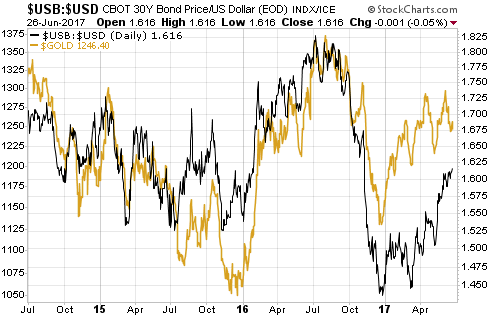
There are fundamental reasons for the existence of a positive correlation between the bond/dollar ratio (the T-Bond price divided by the Dollar Index) and the US$ gold price, but I currently don’t have the time or the inclination to go into these reasons. Instead, for the sake of brevity I present the following chart-based comparison of the gold price and the bond-dollar ratio. The positive correlation is obvious and is evident over much longer periods than the 3-year period covered by this chart.
I hope the above goes at least part of the way towards explaining the components of my gold model.
 Print This Post


