Here is an excerpt from a commentary posted at TSI last week. Not much has changed in the interim, so it remains applicable.
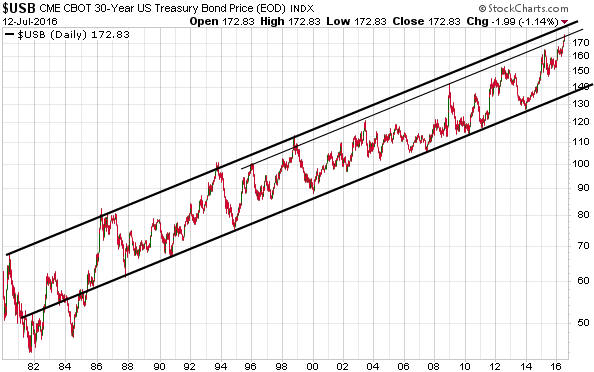
The US Treasury Bond (T-Bond) entered a secular bullish trend in the early-1980s. As evidenced by the following chart, over the past 30 years this trend has been remarkably consistent.

There is no evidence, yet, that the long-term bull market is over. Furthermore, such evidence could take more than a year to materialise even if the bull market reaches its zenith this month. The reason is that for a decline to be clearly marked as a downward leg in a new bear market as opposed to a correction in an on-going bull market it would have to do something to differentiate itself from the many corrections that have happened during the course of the bull market. In particular, it would have to result in a solid break below the bottom of the long-term channel. This is something that probably wouldn’t happen until at least the second half of next year even if the bull market just reached its final peak.
However, we don’t need to have an opinion on whether or not the bull market is about to end to see that the risk/reward is currently favourable for a bearish T-Bond speculation. What we need to do is look at a) future “inflation” indicators, which point to rising price inflation over the coming months, b) sentiment indicators, which suggest the potential for a large majority of speculators to be caught wrong-footed by a T-Bond decline, and c) the position of the T-Bond within its long-term channel.
With regard to the channel position, to become as stretched to the upside as it was at the 1986, 1993 and 1998 peaks the T-Bond would have to move about 5 points above this month’s high, but it is already at least as stretched to the upside as it was at the 1996, 2003, 2008, 2012 and 2015 peaks.
Needless to say, we continue to like the bearish T-Bond trade.
 Print This Post
