Print This Post Print This Post

Helicopter Money

July 29, 2016

Here is an excerpt from a recent TSI commentary about another absurd course of action now being seriously considered by the monetary maestros.

Once upon a time, the concept of “helicopter money” was something of a joke. It was part of a parable written by Milton Friedman to make a point about how a community would react to a sudden, one-off increase in the money supply. Now, however, “helicopter money” has become a serious policy consideration. So, what exactly is it, how would it affect the economy and what are its chances of actually being implemented?

“Helicopter money” is really just Quantitative Easing (QE) by another name. QE hasn’t done what central bankers expected it to do, so the idea that is now taking root is to do more of it but call it something else. Apparently, calling it something else might help it to work (yes, the people at the upper echelons of central banks really are that stupid). The alternative would be to question the models and theories upon which QE is based, but such questioning of underlying principles must never be done under any circumstances. A Keynesian economist calling into question the principle that an economy can be made stronger via methods that artificially stimulate “aggregate demand” would be akin to the Pope questioning the existence of god.

The only difference between QE as practiced by the Fed and “helicopter money” is the path via which the new money gets injected. Under the Fed’s previous QE programs, new money was created via the monetisation of debt and ended up in the accounts of securities dealers*. Under a “helicopter money” program, new money would still be created via the monetisation of debt. However, in this case the new money would be placed by the government into the accounts of the general public, via, for example, tax cuts and welfare payments (handouts), and/or placed by the government into the accounts of contractors working for the government.

If promoted in the right way, “helicopter money” could have widespread appeal among the general public. Unlike the Fed’s traditional QE, which had the superficial effect of making the infamous top-1% richer and the majority of the population poorer, the average member of the voting public could perceive an advantage for himself/herself in “helicopter money”. Unfortunately, regardless of who gets the new money first there is no way that an economy can be anything other than weakened by the creation of money out of nothing. The reason is that the new money falsifies the price signals upon which economic decisions are made, leading to ill-conceived investments and other spending errors.

Due to the distortions of price signals that they bring about, both traditional QE and “helicopter money” are bad for the economy. However, an argument could be made that “helicopter money” is the lesser of the two evils. The reason is that with “helicopter money” the effects of the monetary inflation will more quickly become apparent in everyday expenses and the popular price indices. That is, “helicopter money” will quickly lead to inflationary effects that are obvious to everyone. This limits the extent to which the policy can be implemented.

Putting it another way, traditional QE had by far its biggest effects on the prices of things that, according to the average economist, central banker and politician, don’t count when assessing “inflation”, whereas the effects of “helicopter money” would soon become obvious in the prices of things that do count. A consequence is that a “helicopter money” program would be reined-in relatively quickly and the long-term damage to the economy would be mitigated.

With regard to the chances of “helicopter money” actually being implemented, we think the chances are very good in Japan, very poor in the euro-zone (due to there being a single central bank ‘serving’ a politically-disparate group of countries) and somewhere in between in the US.

Although it presently seems like the more extreme policy, the US has a better chance of experiencing “helicopter money” than negative interest rates within the next two years. This is because a) the next US president will be an economically-illiterate populist (regardless of who wins in November), b) the average voter will likely perceive a financial advantage from “helicopter money”, and c) hardly anyone outside the halls of Keynesian academia will perceive anything other than a disadvantage from the imposition of negative interest rates.

In summary, then, “helicopter money” is QE by a different name and path. It would inevitably reduce the rate of economic progress, but it has a reasonable chance of being implemented in the US the next time that policy-makers are desperate to do something.

*Every dollar of Fed QE adds one dollar to the commercial bank account of a Primary Dealer (PD) and one dollar to the reserve account at the Fed of the PD’s bank, meaning that every dollar of QE adds one reserve-covered dollar to the economy-wide money supply.


Print This Post Print This Post

Bearish on T-Bonds

July 22, 2016

Here is an excerpt from a commentary posted at TSI last week. Not much has changed in the interim, so it remains applicable.

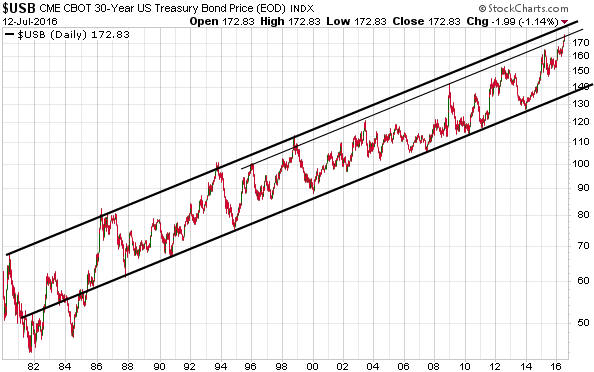
The US Treasury Bond (T-Bond) entered a secular bullish trend in the early-1980s. As evidenced by the following chart, over the past 30 years this trend has been remarkably consistent.

There is no evidence, yet, that the long-term bull market is over. Furthermore, such evidence could take more than a year to materialise even if the bull market reaches its zenith this month. The reason is that for a decline to be clearly marked as a downward leg in a new bear market as opposed to a correction in an on-going bull market it would have to do something to differentiate itself from the many corrections that have happened during the course of the bull market. In particular, it would have to result in a solid break below the bottom of the long-term channel. This is something that probably wouldn’t happen until at least the second half of next year even if the bull market just reached its final peak.

However, we don’t need to have an opinion on whether or not the bull market is about to end to see that the risk/reward is currently favourable for a bearish T-Bond speculation. What we need to do is look at a) future “inflation” indicators, which point to rising price inflation over the coming months, b) sentiment indicators, which suggest the potential for a large majority of speculators to be caught wrong-footed by a T-Bond decline, and c) the position of the T-Bond within its long-term channel.

With regard to the channel position, to become as stretched to the upside as it was at the 1986, 1993 and 1998 peaks the T-Bond would have to move about 5 points above this month’s high, but it is already at least as stretched to the upside as it was at the 1996, 2003, 2008, 2012 and 2015 peaks.

Needless to say, we continue to like the bearish T-Bond trade.

Print This Post Print This Post
You can make statistics say whatever you want

July 19, 2016

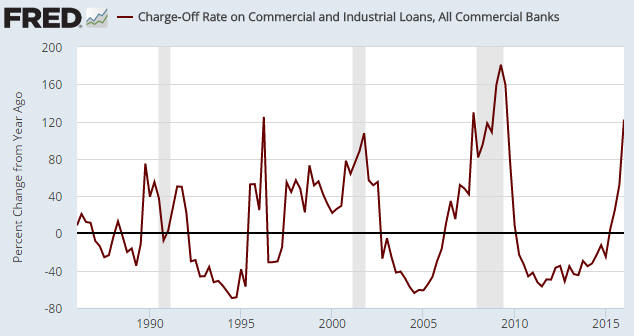
A chart similar to the one below was included in a blog post under the heading “Bank C&I Loan Charge-Offs Soaring Again”. This chart caught my attention because it seems to indicate that bank C&I (Commercial and Industrial) loan charge-offs are happening at one of the fastest rates of the past 30 years — the sort of rate that would be consistent with the US economy being in recession.

CI_YOYpercent_190716

The problem is that the above chart shows the percentage change of a percentage, which opens up the possibility that what is in reality a small increase is being made to look like a large increase. For example, an increase from 1% to 2% over the course of a year in the proportion of loans charged-off would be a 100% increase if expressed as a year-over-year percentage change in the percentage of charge-offs, whereas all you’ve actually got is a 1% increase in the total proportion of loans that have been charged-off.

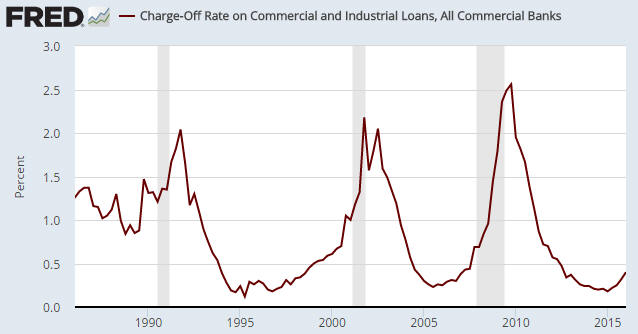
The next chart is based on exactly the same data, but instead of displaying the year-over-year percent change in the percentage of C&I loans that have been charged off it simply displays the percentage of C&I loans that have been charged off. This is not just a more correct way of looking at the data, it is a way that has not given any false recession signals over the past 30 years.

CI_percent_190716

The first chart’s message is: an economic recession is either in progress or imminent. The second chart’s message is: the US economy is not in recession and is presently not close to entering recession.

The same data, opposite messages.

Print This Post Print This Post
Interest rates are NOT the price of money

July 19, 2016

Rarely does a month go by when I don’t read at least one article in which interest rates are said to be the price of money. This is wrong. The price of money is what money can buy. The rate of interest is something completely different.

If an apple sells for 1 dollar then the price of a unit of money in this example is 1 apple. If a car sells for 30,000 dollars then the price of a unit of money in this example is 1/30,000th of a car. In more general terms, just as the price of any good, service or asset can be quoted in terms of money, the price of money can be quoted in terms of the goods, services and assets that it buys. In a large economy, at any given time a unit of money will have millions of different prices.

As an aside, this is why price indices that purport to represent the purchasing power of money will always be bogus. Regardless of how rigorous and well-intentioned the effort, it is not possible to come up with a single number that properly indicates the “general price level”. There is simply no such thing as the general price level.

What, then, is the interest rate?

The interest rate is the cost incurred or the payment received for exchanging a present good for a future good. If there is no risk of loss involved in the transaction then the interest rate will reflect nothing other than the time preferences of the person who parts with the present good (usually called the lender) and the person who receives the present good (usually called the borrower). In other words, if there is no risk of loss then the interest rate can correctly be thought of as the price of time.

In most cases there will, of course, be a risk of loss due to the possibility that the borrower will default or the possibility — if it was money that was exchanged — that the loan will be repaid in terms of money that doesn’t buy as much as it did when the initial exchange took place. In most cases the interest rate will therefore be the price of time plus a premium to account for default risk and “inflation” risk.

Time preference sets a lower limit on market interest rates and time preference will always be positive. The negative interest rates set in place by some central banks therefore have nothing to do with market forces and everything to do with heavy-handed manipulation by people who have far more power than sense.

Print This Post Print This Post

Are central banks out of bullets?

July 15, 2016

In a recent letter John Mauldin worries that central banks are ‘out of bullets’, but this is not something that any rational person should be worried about. Instead, they should be worried about the opposite.

The conventional view is that with interest rates at all-time lows and with vast amounts of debt having already been monetised, if a recession were to occur in the not-too-distant future there would be nothing that the central banks could do to ameliorate it. However, this view is based on the false premise that central banks can smooth-out the business cycle by easing monetary policy at the appropriate time. The truth is that by distorting interest rates, central banks get in the way of economic progress and cause recessions to be more severe than would otherwise be the case.

Think of it this way: If it is really possible for a committee of bureacrats and bankers to create a better outcome for the economy by setting interest rates (the price of credit), then it logically follows that a healthier economy would result from having all prices set by committees comprised of relevant ‘experts’. There should be an egg committee to set the price of eggs, a car committee to set the price of cars, a massage committee to set the price of massages, etc. After all, if it really is possible for a committee to do a better job than a free market at determining the most complicated of prices then it is certainly possible for a committee to do a better job than a free market at setting any other price.

However, hardly anyone believes that all prices should be set by committee or some other governing body. This is undoubtedly because that type of price control proved to be an unmitigated disaster wherever/whenever it was tried throughout history. Most people therefore now realise that it would make no sense to have committees in place to control prices in general, but are strangely incapable of making the small logical step to the realisation that it makes no sense to give a committee the power to control the most important price in the economy — the price of something that influences the price of almost everything else.

Getting back to the worry that central banks are out of bullets, it would actually be good news if they were. This is because a central bank does damage to the economy every time it fires one of its so-called monetary bullets. The damage usually won’t be apparent to the practitioners of the superficial, ad-hoc economics known as Keynesianism, but it will inevitably occur due to the falsification of price signals.

Unfortunately, central banks have an unlimited supply of bullets. This has been demonstrated over recent years by zero not proving to be a lower boundary for the official interest rate and by asset monetisation proving to be not restricted to government bonds. We should therefore expect central banks to keep firing until they are reined-in by market or political forces.

The real worry, then, isn’t that central banks are out (or almost out) of bullets. The real worry is that they are not remotely close to being out of bullets.

Print This Post Print This Post

Shipping rates will never go to zero

July 13, 2016

When the Baltic Dry Index (BDI), an index of international ocean-going freight rates, plunged to a multi-decade low early this year it provoked excited commentary from the “economic armageddon is nigh!” crowd. An example can be found HERE. However, bearish commentary is unhelpful after the prices of useful things have fallen to the point where the suppliers of these things are financially in dire straits.

There’s always a risk that the stock price of an individual company will go to zero, but there’s never a risk that freight rates or the prices of useful commodities will go to zero. Therefore, the further they move into an area where they are low by historical standards, the lower the downside risk will generally be.

I’m lumping ocean-going shipping rates and commodity prices together in this post because they are linked. They usually trend in the same direction and reach important peaks/troughs at around the same time. A consequence is that it doesn’t make sense to be bullish on commodities and at the same time anticipating a large decline in shipping rates, or bearish on commodities and at the same time anticipating strength in shipping rates. For example, after commodity prices reversed upward during January-February of this year it made no sense to expect a continuing downward trend in shipping rates.

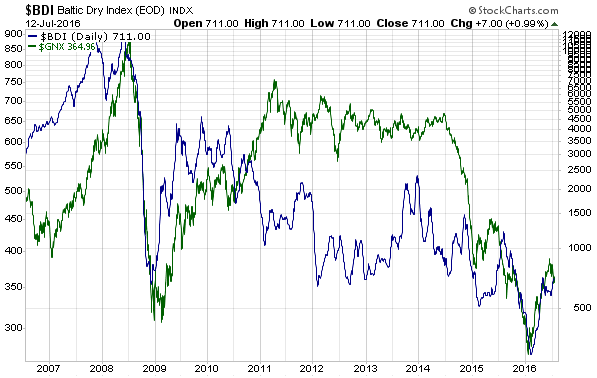
The link between shipping rates (as represented by the BDI) and commodity prices (as represented by the Goldman Sachs Spot Commodity Index – GNX) is illustrated below. The two indexes have been positively correlated for a long time. Divergences are not uncommon, but the divergences are always short-term.

BDI_blog_120716

So, here’s an idea: Rather than piling onto the bearish bandwagon, when the real price of an indispensable service or commodity drops to a multi-decade low it might make more sense to be bullish.

Print This Post Print This Post

The US banking system has no control over its reserves

July 12, 2016

A popular line of thinking is that the US banking system is not making as much use of its “excess” reserves as it should be because of the interest rate that the Fed now pays on these reserves. This line of thinking reflects a basic misunderstanding of how the banking system works.

There are two reasons why it is wrong to believe that the 0.50% interest rate now being earned by US banks on their reserves is encouraging the banks to stockpile money at the Fed rather than take a risk by making more loans. The first reason is that there is no relationship between bank lending (and the associated creation of new bank deposits) and bank reserves. I’ve covered this concept in previous blog posts, including HERE, so today I’ll focus on the second reason.

The second reason is that the banking system has no control over its reserves. An individual bank can reduce its reserves by lending reserves to another bank, but banks as a group have no say in the total quantity of reserves. In other words, even if the US banking system desperately wanted to reduce its collective reserve quantity it would be powerless to do so.

By way of further explanation, there are only three ways that reserves can leave the US banking system. They can be removed by the Fed (the Fed has unlimited power to add or delete reserves), they can exit in the form of notes and coins in response to increasing public demand for physical cash, or they can be transferred to governmental accounts at the Fed. The third way will always be temporary because the government is always quick to spend any money it gets, so there are really just two ways that the banking system’s reserves can decline: a deliberate action by the Fed or increased demand for physical cash within the economy.

In other words, regardless of how many loans are made and how many new commercial bank deposits are created, every dollar of reserves currently in the US banking system will remain there until the Fed decides to change the system-wide level or until it leaks into the economy via the conversion of electronic deposits to physical cash.

An implication is that changing the rate of interest that the Fed pays on reserves will not affect the pace at which banks expand/contract credit within the economy. For example, if the Fed increased the interest rate on reserves from 0.50% to 1.00% the banks would generate more interest income from their reserves, but there would be no change in the incentive to make new loans because the banks will earn this additional income regardless of whether they lend more or less money into the economy (the creation of a bank loan doesn’t cause bank reserves to disappear). For another example, if instead of paying banks a positive rate on their reserves the Fed started charging banks, that is, if the Fed adopted Negative Interest Rate Policy (NIRP), the banking system as a whole would have no additional incentive to grow its loan book since there would be nothing it could do to avoid the cost. In fact, the cost imposed by the NIRP could indirectly REDUCE the incentive to make new loans.

As an aside, this doesn’t guarantee that NIRP won’t happen in the US, especially given the evidence that the Fed’s senior management is almost as clueless as Mario Draghi. However, the obvious failure of the policy in Europe lessens the risk of it happening in the US.

Summing up, the interest rate paid on reserves cannot be a reason for either more or less bank lending. As explained previously, the only reason that the Fed began paying interest on bank reserves in late-2008 was to enable it to maintain control of the Fed Funds Rate while it pumped huge volumes of dollars into the economy and into the reserve accounts of banks.

Print This Post Print This Post

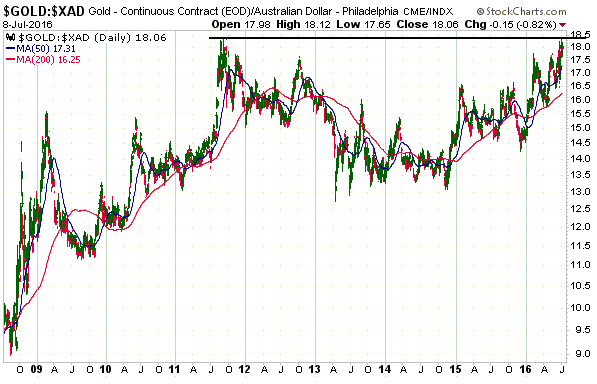
Gold is testing its 2011 high…

July 10, 2016

in Australian dollar (A$) terms.

The A$-denominated gold price (gold/A$) made a correction low in April of 2013, spent about 18 months forming a base and then resumed its long-term bull market in late-2014. It will probably soon make a new all-time high.

gold_A$_100716

It is useful to follow gold’s performance in terms of the more-junior currencies, for two main reasons. First, gold tends to bottom in terms of these currencies well before it bottoms in terms of the senior currency (the US$). Second, money can sometimes be made by owning the stocks of gold-mining companies operating in countries with relatively weak currencies even when the US$ gold price is in a bearish trend.

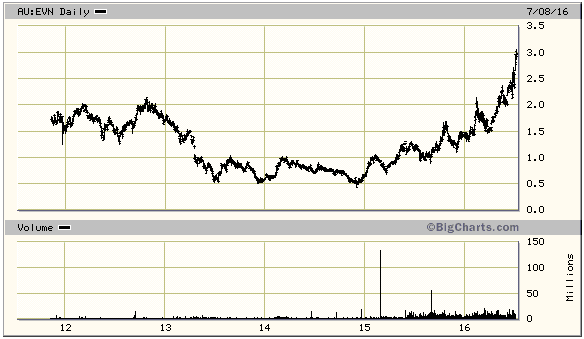
A good example is Evolution Mining (EVN.AX), an Australia-based mid-tier gold producer that I’ve followed at TSI for the past few years. As illustrated by the following chart, EVN commenced a powerful upward trend in late-2014 after basing over the preceding 18 months (just like gold/A$). It is now well above its 2011-2012 peak.

EVN_100716

As a gold bull market progresses, the more junior currencies and especially the commodity currencies begin to strengthen relative to the US$. This causes the mining companies with operations in the US to start doing relatively well.

Print This Post Print This Post

The hyperinflation and deflation arguments are both wrong

July 6, 2016

Most rational people with some knowledge of economic history will realise that the US$ will eventually be the victim of hyperinflation. The hard reality is that whenever money can be created in unlimited amounts by central banks or governments, it’s inevitable that at some point the money will experience such a dramatic plunge in its purchasing power that it will be at risk of soon becoming worthless. However, knowing this is only slightly more useful than knowing that the star we call the Sun will eventually die.

The relevant question is never about whether hyperinflation will happen; it’s about the timing, and at no point over the past 20 years (including right now) has there been a realistic chance of the US experiencing hyperinflation within the ensuing two years. Furthermore, the same can be said about deflation. A sustained period of deflation (as opposed to a short-lived deflation scare) will eventually happen, but at no point over the past 20 years (including right now) has there been a realistic chance of it happening within the ensuing two years.

So, when I say that the hyperinflation and deflation arguments are both wrong I mean that they are both wrong when dealing with practical investment time-frames. They are both actually right when dealing with the indefinite long-term.

By the way, when considering inflation/deflation prospects I only ever attempt to look ahead two years, partly because two years is plenty of time to take protective measures and partly because it is futile to attempt to look further ahead than that.

How do I know that neither hyperinflation nor deflation will happen in the US within the coming two years?

I don’t know, but I do know that neither will happen without warning. We are not, for example, going to go to bed one day with government and corporate bond yields near multi-generational lows and wake up the next day immersed in hyperinflation. Also, central banks are not going to be rigidly devoted to pro-inflation monetary policies one day, to the point where theories/models are never questioned and failure is viewed as the justification for ramping-up the same policies, and the next day be willing to implement the sort of monetary policies that could lead to genuine deflation.

Some people are so committed to the “deflation soon” forecast that they ignore any conflicting evidence. It’s the same for people who are committed to the idea that hyperinflation is an imminent threat to the US economy. However, an objective assessment of the evidence leads to the conclusion that it currently makes no sense to position oneself for either of these extremes. The evidence includes equity prices, corporate bond yields, credit spreads, the yield curve, commodity prices, the gold price, and future “inflation” indicators such as the one published by the ECRI.

The evidence could change, but what it currently indicates is that the signs of “price inflation” will become more obvious over the coming 12 months. No deflation, no hyperinflation.

Print This Post Print This Post