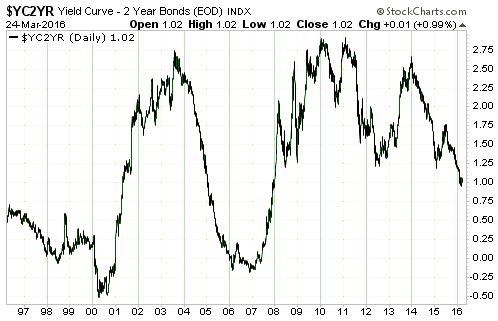
The most important fundamental driver of the gold market that hasn’t yet begun to move in a gold-bullish direction is the US yield curve, represented on the following chart by the 10yr-2yr yield spread. The yield curve is bullish for gold when it is getting steeper, as indicated by a rising 10yr-2yr yield spread (a rising line on the following chart). With the 10yr-2yr yield spread having recently made a new 8-year low and not yet shown any sign of reversing upward, the yield curve remains unequivocally gold-bearish.
The yield curve is also one of the most important economic indicators to not yet warn of a US recession. Note that contrary to popular opinion it isn’t an inversion of the yield curve (the 10yr-2yr yield spread dropping below zero) that warns of a recession, it’s a trend reversal from flattening to steepening after the yield-spread has fallen to a multi-year low.
Based on what happened over the past 50 years, a trend reversal in the yield spread is not a prerequisite for a gold bull market. As long as sufficient other fundamental drivers (e.g. credit spreads and the real interest rate) are gold-bullish it is possible for gold to commence a bull market in the absence of a supportive yield curve. This is exemplified by the bull market that began during 1976-1977. However, it would be unprecedented for a US recession to begin in the absence of an upward reversal in the 10-yr-2yr yield spread.
 Print This Post

