This post is a slightly-modified excerpt from a recent TSI commentary.
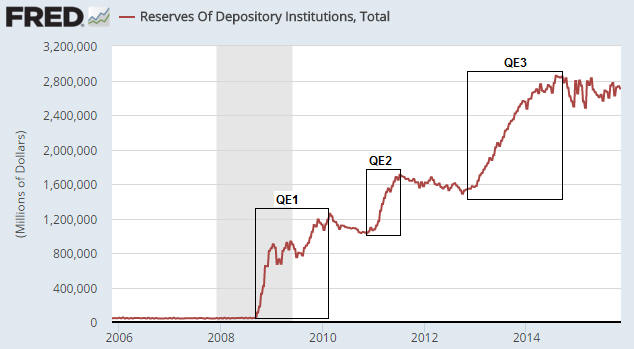
In the US, the commercial banks can create money and the Fed can create money. A chart showing the change in the US money supply therefore won’t directly tell us if the Fed was a creator of new money during the period covered by the chart. However, unlike the commercial banks, when the Fed monetises debt it boosts bank reserves as well as the money supply, which means that we can quickly identify the periods during which the Fed was a direct creator of new money by looking at a chart of the total quantity of US bank reserves. Such a chart is displayed below.
With reference to this chart, notice the huge rises in bank reserves during the periods labeled “QE1″, “QE2″ and “QE3″. These are the times when the Fed was directly creating new money. The downward/sideways drifts in bank reserves prior to the start of “QE1″, between the QE programs and since the end of “QE3″ are times when the Fed was not directly creating new money. The US money supply still increased during these ‘non-QE’ periods, but it increased due to the actions of commercial banks rather than the direct intervention of the Fed.
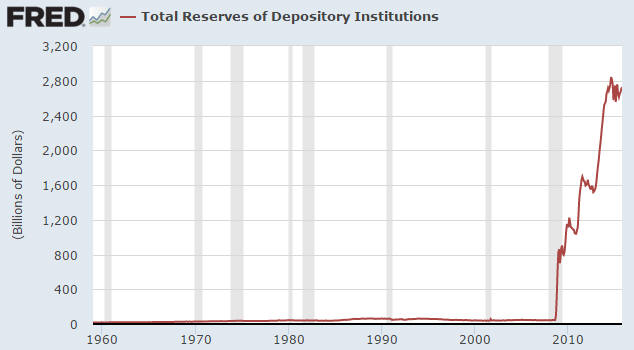
To put the 2008-2015 period into perspective, here is a chart showing the total quantity of US bank reserves going back to 1959. Notice that for decades prior to 2008, total bank reserves hovered just above zero. There was a lot of monetary inflation during this period, but almost none of it was due to the direct creation of money by the Fed.
As an aside, if you compare the above chart of bank reserves with a chart of commercial bank credit you will see that over the past few decades there has been no relationship between bank reserves and the quantity of money loaned into existence by US commercial banks. That’s why, as I wrote in a recent blog post (https://tsi-blog.com/2015/10/the-zero-reserve-banking-system/), it’s more realistic to think of the US as now having a zero-reserve banking system as opposed to a fractional-reserve banking system. Bank reserves are a throw-back to an earlier monetary system, when gold was held in reserve and receipts for gold circulated within the economy. It makes no sense to have dollars backed by dollars, especially since the quantity of dollars held in reserve in no way determines/limits the quantity of dollars loaned into existence or held in bank deposits.
An extraordinary situation can start to seem ordinary if it persists for long enough, so the main point I wanted to reiterate with the help of the above charts is that the past several years constitute a massive and unprecedented departure from the Fed’s traditional mode of operation. An implication is that the Fed’s next monetary tightening program, which may or may not tentatively begin with a tiny rate hike in December, will not look like any previous monetary tightening program. The “uncharted waters” cliche is now very appropriate.
 Print This Post

