A recent Mineweb article comments: “…it does seem to be odd that given the huge undisputed flows of physical gold from West to East that the gold price has performed so badly over the past few years.” Actually, no, it doesn’t seem odd at all, since the flow of gold from sellers in one part of the world to buyers in another part of the world suggests nothing about the price. A net flow of gold from “West” to “East” is not inherently bullish and a net flow of gold from “East” to “West” would not be inherently bearish. Through bull markets and bear markets, some individuals, parts of the market and regions of the world will be net buyers and other individuals, parts of the market and regions of the world will be net sellers. Anyhow, the main purpose of this post isn’t to rehash the concept that the volume of gold being transferred between sellers and buyers contains no information about the past or likely future change in the gold price, it’s to make the point that gold’s price must bear some resemblance to the prices of other useful commodities.
Due to its nature, including its traditional role as a store of value, gold is capable of trending upward in price while most other commodities are trending downward in price. However, there are limits that have been defined by the historical record.
One of these limits is 26 barrels of oil. The historical record tells us that gold is very expensive relative to oil when the gold/oil ratio moves above 26. Even at the crescendo of the 2008-2009 Global Financial Crisis, when the fundamental backdrop was as bullish as it ever gets for gold relative to oil, the gold/oil ratio didn’t rise above 28. And yet, in January of this year the ratio got as high as 29. This was the highest since 1988 and not far from a 40-year high.
In other words, gold was so expensive relative to oil earlier this year that it would have made no sense to expect significant additional gains in the US$ gold price without a substantial recovery in the US$ oil price.
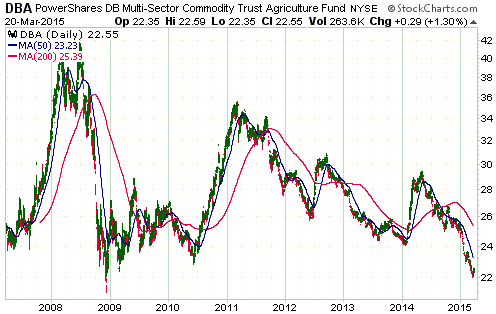
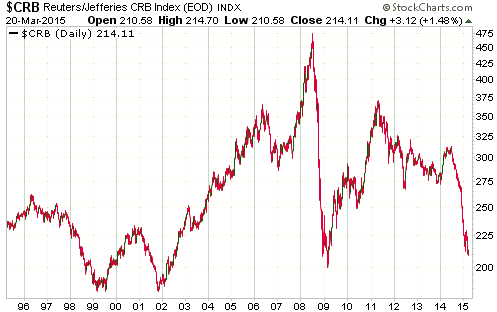
It’s a similar situation with many other commodities. For example, the following two charts show that a proxy for agricultural commodities and a proxy for commodities in general came within spitting distance of their respective 2008-2009 financial-crisis lows last week. Given that gold is presently trading about 70% above its 2008-2009 low, the appropriate question isn’t “why has gold performed so badly?” it’s “why has gold held up so well?”. I think it’s because there are plenty of well-heeled people in the world who are aware of the eventual consequences of the current monetary experiments and are buying gold as a form of insurance.


My point is that although some of gold’s most important fundamental price drivers are unique to gold, the gold price should never become completely divorced from the prices of other useful commodities. Considering the prices of other commodities, it would make no sense for the gold price to be substantially higher than it is today.
 Print This Post
