Print This Post Print This Post

Close to the most extreme market sentiment ever

October 31, 2014

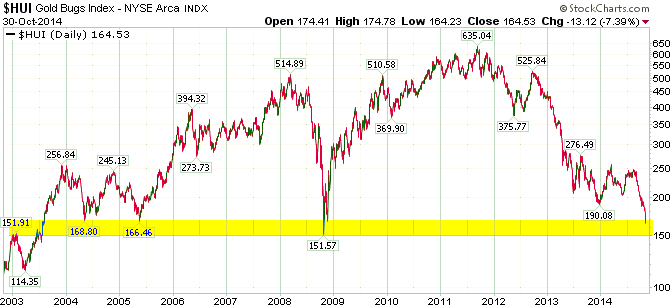
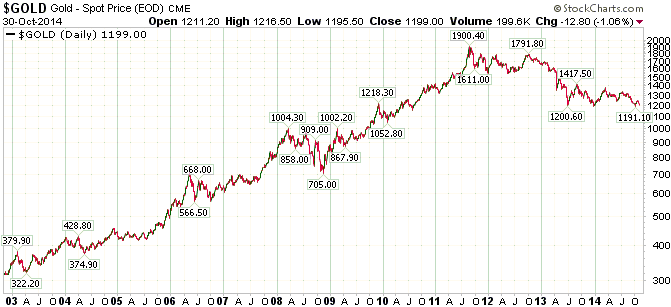
TSI subscribers will soon receive an email alert regarding Thursday’s panic in the gold-mining sector, including brief thoughts on what it means for the days ahead and the actions that I am planning to take. The purpose of this post is to highlight the starkly contrasting long-term charts of the HUI and the US$ gold price. The relevant charts are displayed below.

There was already a dramatic difference between the HUI and gold charts prior to this week, but the price action of the past two trading days has magnified the difference. The HUI is now slightly below its 2004 and 2005 lows, and is within spitting distance of its 2008 crash low. At the same time, gold hasn’t even breached its lows of the past year and is trading about 220% above its 2004 low.

I think that the HUI’s position relative to gold equates to one of the most extreme market sentiment situations ever. It is, I think, right up there — in terms of magnitude, but at the opposite end of the sentiment spectrum — with the March-2000 upside blow-off in the NASDAQ.

HUI_301014


gold_301014

Print This Post Print This Post

Annual gold-mine supply is just 1.5% of total gold supply

October 28, 2014

One of my readers sent me the following two-paragraph excerpt — written by someone called “Bill H” about a debate between Chris Powell and Doug Casey at a recent conference — from a commentary at lemetropolecafe.com, a web site dedicated to the idea that downward price manipulation dominates the gold market. He asked me to comment on the second paragraph, but I’ll do better than that — I’ll comment on both paragraphs. I’ll explain why the first paragraph contains a misunderstanding about economics and why the second paragraph reveals extreme ignorance of the gold market. First, here’s the excerpt:

Powell also pointed to Larry Summer’s Gibson paradox study where low gold prices also aid in low interest rates and allow for more debt and currency issuance than would otherwise be the case. He also pointed to documents from the CME that shed light on the fact the central banks are “customers” and actually receive volume discounts for trading. Chris then mentioned that just because gold has gone higher, this is not evidence of no suppression as gold would or could be much higher in price if it were not for suppression. In answer to Casey’s statement “we would never suppress the prices of gold and silver because this would aid the Chinese and Russians”, insider Jim Rickards claims a “deal” has been struck with the Chinese.

I have no proof of this one way or the other but it does make perfect sense to me. I could write an entire piece on this subject but for now a paragraph will have to suffice. If China (and India) are buying more than the entire year’s global production of gold …yet the price has been dropping during this operation …the metal HAS to be coming from somewhere. The ONLY “somewhere” this can be is from where it is (has) being stored, central bank vaults. The only possible way for prices to not rise when physical demand grossly exceeds supply is through the use of paper derivatives. It is really just this simple. In my opinion what Jim Rickards has said must have some truth behind it, some sort of deal has to have been struck which allows China/India (and Russia) to purchase increasing amounts of gold at decreasing prices. As I have said all along, once China cannot receive gold in exchange for dollars …then of what use are their dollar holdings? Do you see? The game will be up and there will be no incentive to China whatsoever to hold any dollars which will …end the game.

The misunderstanding about economics has three parts.

First, “Gibson’s Paradox” only applies in the context of a Gold Standard. It has no relevance to the current monetary system.

Second, there is actually no paradox.

As an aside, Keynesian economists sometimes arrive at what they consider to be paradoxes, the “Paradox of Thrift” being the classic case. However, this is only because they are being guided by hopelessly flawed economic theories. For example, Keynesians get the economic growth process completely backward. They think it begins with consumer spending, when in reality it ENDS with consumer spending and begins with saving. That’s why they believe that an economy-wide increase in saving (meaning: a reduction in consumer spending in the present) is bad for the economy and must be discouraged. In the case of “Gibson’s Paradox”, which revolves around the link between interest rates and the general price level under a Gold Standard, there will only be a paradox for the economist who doesn’t understand the relationship between interest rates and time preference (the desire to spend money in the present relative to the desire to delay spending (to save, that is)).

Third, if gold were being manipulated today in accordance with the relationship between gold and interest rates that existed during the Gold Standard, then an effort to create lower interest rates would involve an effort to manipulate the price of gold UPWARD relative to the prices of most other commodities (under the Gold Standard, a decline in interest rates tended to be associated with a rise in the purchasing power of gold). Strangely, this is what happened over the past 7 years, in that the gold/commodity (gold/CCI) ratio rose as interest rates fell and reached a multi-generational high in 2012 at around the same time as interest rates on long-dated US Treasury securities reached a multi-generational low.

Now, I’m not saying that gold was manipulated upward relative to other commodities as part of an attempt to suppress interest rates. These days central banks make full use of their power to manipulate interest rates directly, thus obliterating any reliable link between the price of credit and the general desire to spend/save. Central banks have even gone a long way towards obliterating any link between the price of credit and the risk of default. In a nutshell, interest rates have been distorted to the point where they no longer provide valid signals. What I’m saying is that you need to have a sub-par understanding of economics to believe that gold has been manipulated downward as part of a scheme to create lower interest rates.

I could write a lot more about the relationships between economy-wide time preference, interest rates, the general price level and gold, but I don’t want to get bogged down and this post is already longer than originally intended. Instead, let’s move on to the second of the excerpted paragraphs.

I was particularly impressed by the following sentences:

“If China (and India) are buying more than the entire year’s global production of gold …yet the price has been dropping during this operation …the metal HAS to be coming from somewhere. The ONLY “somewhere” this can be is from where it is (has) being stored, central bank vaults. The only possible way for prices to not rise when physical demand grossly exceeds supply is through the use of paper derivatives. It is really just this simple.”

These sentences reflect a very basic misunderstanding about the gold market that I end up addressing several times every year in TSI commentaries. The fact is that the supply of gold is NOT the annual amount of gold produced by the mining industry. Rather, the mining industry adds only about 1.5% to the total supply of gold every year. This is why changes in mine production have almost no effect on gold’s price trend and why it is illogical to compare the gold demand of some countries or regions with annual mine production.

The total supply of gold is around 170,000 tonnes, and over the next 12 months the mining industry will add about 2,500 tonnes to this total supply. Furthermore, the mining industry is no different to any other seller (an ounce of gold mined over the past year is the same as an ounce of gold that has been sitting in storage for the past 200 years), except that it is price-insensitive. The mining industry will sell its 2,500 tonnes regardless of price, whereas the actions of the holders of the existing 170,000 tonnes of aboveground gold will be influenced by changes in the gold price and changes in the perceived attractivess of gold as an investment or store of value.

Some existing holders (the weak hands) are likely sellers in response to price weakness, whereas other holders are likely sellers in response to price strength. Some existing holders will change their plans based on their assessments of current and likely future conditions, whereas others will be determined to hold forever. At the same time there are a huge number of potential buyers, some of whom will be planning to buy in response to lower prices, some of whom will be likely to buy in response to signs of an upward trend reversal, and many of whom will change their plans based on changes in the financial world.

The main point to be appreciated here is that it’s the urgency to sell on the parts of existing holders of the total gold stock relative to the urgency to buy on the parts of prospective new owners that determines the change in price. As noted above, the gold mining industry is just one small piece of a very big puzzle.

Finally, I’m not going to attempt to debunk the unsubstantiated claim that the US government has made a deal with the Chinese government whereby the gold price will be held down to facilitate the latter’s gold accumulation. This is just a nonsensical story.

Print This Post Print This Post
Economic growth causes lower, not higher, prices

October 23, 2014

This blog post is a slightly modified excerpt from a recent TSI commentary.

If you believe in the thesis that world GDP will continue to expand and that population growth will continue, then you should own natural resources. New people who are born will want to eat, drive, and build houses. This trend offers long-term support for natural resources.

The above is a comment by Rick Rule in an article titled “Are the Worst of Times Yet to Come?“. I consider Rick Rule to be a brilliant investor in natural-resource companies and agree with his investment strategy. I also agree with everything in the afore-linked article EXCEPT the above comment. If it is true that the prices of natural resources are supported by economic and population growth, then why is it that world population and world GDP have grown relentlessly over the past 200 years and yet over that entire period the real prices of most commodities have been in downward trends?

The fact is that economic growth causes prices, including the prices of most natural resources, to become LOWER, not higher. Real growth involves producing more with less. That’s why the fastest-growing industries generally have downward-trending product prices. However, the downward trend in prices that would otherwise occur due to real growth can be counteracted by monetary inflation and political intervention, and these days that’s exactly what happens most of the time. These days, monetary inflation causes prices (prices in general, not all prices) to have an upward bias even during periods of economic progress — periods when prices, on average, should be trending downward. This is because in addition to reducing the purchasing power of money, an effect of monetary inflation is to make the economy less efficient by distorting relative price signals. Political intervention also puts upward pressure on prices by placing obstacles in the way of more efficient production.

Consequently, genuine economic growth is most definitely not an ingredient for large rises in natural-resource prices. Instead, two of the three main ingredients are monetary inflation and an increase in politically-motivated/directed spending.

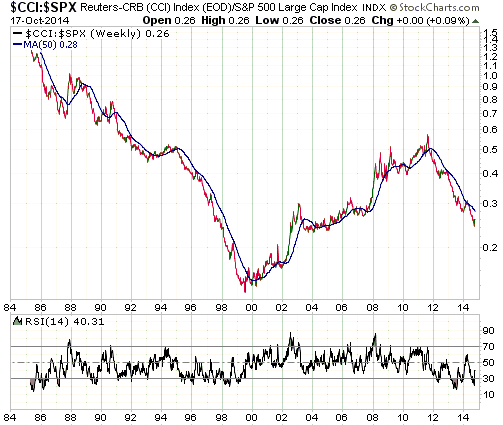
The third main ingredient is valuation. The relative valuations of different assets and commodities will have a big influence on which prices are affected the most by the current cycle’s monetary inflation. In particular, for commodities to be major beneficiaries of monetary inflation, commodity prices should be low relative to the prices of equities and bonds. According to the following weekly chart, commodity prices (as represented by the CCI) are currently near a 10-year low relative to the S&P500 Index, which is certainly low enough to enable a multi-quarter period of relative strength.

Print This Post Print This Post
Quick comments on the US stock market and some company news

October 21, 2014

From the Stock market section of the Weekly Market Update posted on 19th October, under the heading “What to do”:

We have no idea what anyone else should do, apart from maintain a substantial cash reserve. Having exited all stock-market-related put options last week, the short-term plan for our own account is to begin averaging into January-2016 SSO (ProShares Ultra S&P500) put options following some additional rebounding activity over the next few weeks. We might also average into the unleveraged, actively-managed bear funds previously mentioned at TSI (BEARX and HDGE).

This plan assumes that a multi-week low was put in place last week. If this assumption is wrong and it turns out that the initial decline from the September peak is not yet over, then we will take no action. We will not enter bearish speculations when the market is in the midst of a sharp decline.

I’m posting this brief comment to advise that if the US stock market opens strongly today (Tuesday) then I will probably take an initial position in the aforementioned SSO put options or some other puts. I want some coverage in case the rebound fails sooner than anticipated.

I also want to make readers aware that Almaden Minerals (AAU) and True Gold Mining (TGM.V) issued bullish press releases earlier today. The news will be discussed, as usual, in the next Weekly Update.

Print This Post Print This Post
New Lows collapsed on Thursday 16 Oct

October 17, 2014

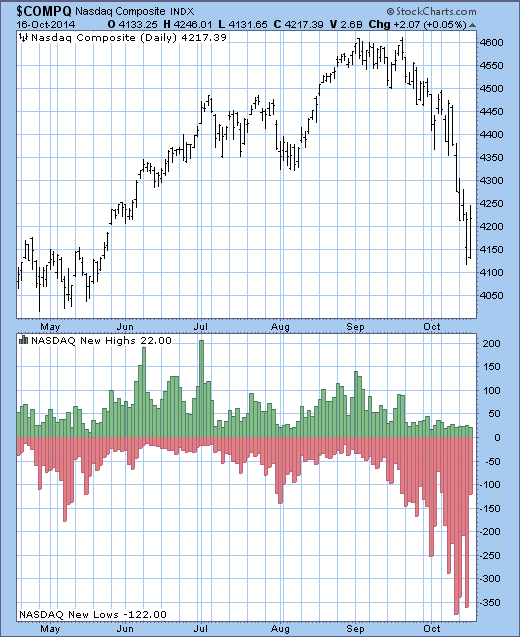
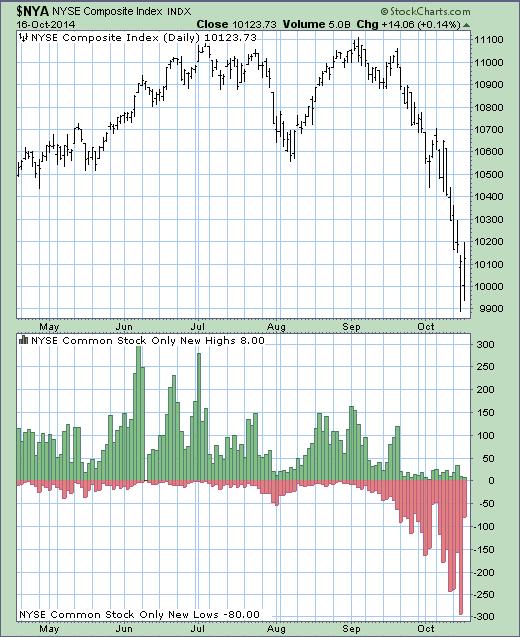
Despite the fact that the NASDAQ Composite and NYSE Composite Indices tested Wednesday’s intra-day lows on Thursday 16th October, the number of individual NYSE and NASDAQ stocks making new 12-month lows collapsed on Thursday. The relevant charts are shown below. Across the NASDAQ and NYSE markets, the number of new lows fell from around 660 on Wednesday to around 200 on Thursday. This has bullish implications with regard to the next few weeks.

NAS_newlows_161014

NYSE_newlows_161014

Print This Post Print This Post
Don’t be in the position of needing the market to do something

October 17, 2014

If you are in the position of needing a market to do something specific in the short term, such as rally or decline by a certain amount, then you are positioned wrongly. You should be positioned in such a way that you can watch the day-to-day price moves with equanimity. Furthermore, unless you make a living from scalping small profits from intra-day fluctuations, you should NOT watch the markets closely during the trading day. No good will come of it, because closely watching the intra-day price action will increase the risk that you will make a spur-of-the-moment decision based primarily on emotion. That is, it will increase the risk of making a mistake.

Before a market in which you have a financial interest opens for trading you should know the prices at which you would be a buyer and the prices at which you would be a seller. You should therefore be able to place any orders prior to the open. You can then check back later — ideally, after the market has closed — to see what happened and which, if any, of your orders were filled.

I feel fortunate to be separated by 12 hours from the stock markets in which most of my stocks trade (the US and Canadian stock markets). This separation removes any temptation that I might otherwise feel to watch the intra-day trading action, because it means that I am usually asleep during the bulk of the trading day.

On a typical day (night) I check the futures markets and company-specific news well before the start of the North American trading session and decide what, if any, new orders are appropriate. Most orders are placed prior to the open, although occasionally I watch the first few minutes of trading before placing an order. I then usually check back after about one hour to see what’s happening before switching off for the night. By the time I switch back on the markets are closed and I can calmly (most of the time) assess the day’s outcome and start thinking about what new orders make sense for the next day.

On a related matter, the majority of the orders I place are either priced well above the market (for sell orders) or well below the market (for buy orders), with the bid and offer prices usually determined by a combination of valuation and chart-related support/resistance. As a result, my orders sometimes sit around for at least a few weeks before getting filled and sometimes don’t get filled at all. I never, ever, use market orders.

Print This Post Print This Post

GLD has all the gold it claims to have

October 14, 2014

Due to the scaremongering of some bloggers, newsletter writers and other promoters of gold manipulation theories, there is still a popular belief within the so-called “gold community” that the SPDR Gold Trust (GLD), the world’s largest gold ETF and for a while in 2011 the world’s largest ETF of any type, doesn’t have all the gold it is supposed to have. There is supposed to be slightly less than one ounce* of allocated gold in the vaults of GLD’s custodian or sub-custodians for every 10 GLD shares, but rumour has it that GLD has put some or all of its gold bullion at risk via gold leasing or other secretive dealings.

The operative word in the above sentence is “rumour”, because there isn’t a shred of evidence that GLD has leased any of its gold or put its gold at risk in some other ‘unacceptable’ way. There is, however, definitive evidence that GLD does have the correct amount of gold. First, GLD maintains a list of every gold bar it owns. The Bar List is located HERE, is updated daily, and contains the serial number, weight and assayed purity of each bar (61,488 of them as at 13th October 2014). Second, the Bar List is audited by Inspectorate International. Specifically, Inspectorate conducts two audits every year of the gold bullion held on behalf of GLD at the vaults of GLD’s custodian. One of these audits involves a complete bar count, meaning that every single bar is inspected and checked against the Bar List. The second audit is a random sample count.

Interestingly, James Turk’s Goldmoney.com also uses Inspectorate to audit the gold in its custodian’s vaults. The latest full audit report of GLD’s gold inventory can be viewed HERE and the latest audit report of Goldmoney’s inventory can be viewed HERE.

Owning GLD is not the same as having physical gold in your possession or having ownership of allocated gold in a vault that you can take delivery of (GLD shares can only be exchanged for gold bullion in 100,000-share lots by Authorised Participants). It is simply a convenient way to trade something that is fully backed by physical gold via the stock market at very low commissions and buy-sell spreads.

If you own GLD shares and plan to maintain your position for 1-2 years or longer then you should give some thought to switching from GLD to GTU (Central Gold Trust), because GTU is currently trading at a discount of almost 8% to net asset value. At current prices, by selling GLD and buying the same dollar amount of GTU you end up with exposure to almost 8% more gold.

*There was originally one ounce of gold for every 10 GLD shares, but the amount of physical gold per GLD share falls by a tiny amount each year due to storage and insurance costs.

Print This Post Print This Post

Does the monetary base drive the gold price?

October 10, 2014

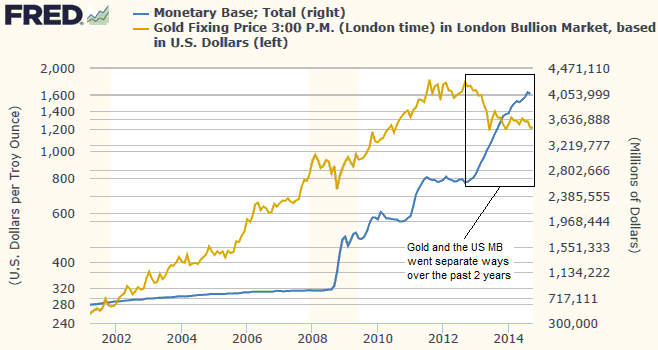
Two weeks ago I discussed the claim that the US debt/GDP ratio (the debt of the US federal government divided by US GDP) drove the gold price, with a rising debt/GDP ratio resulting in a higher gold price and a falling debt/GDP ratio resulting in a lower gold price. I explained that the claim was misleading, and that a chart purporting to demonstrate this relationship was both an example of data mining (in this case, cherry-picking a timescale over which the relationship worked while ignoring more relevant timescales over which it didn’t work) and an example of confusing correlation with causation. I also mentioned in passing that there was a similar misleading claim doing the rounds regarding the relationship between gold and the US monetary base (MB). Considering that the failure of the gold price to follow the US MB higher over the past two years is being cited by the usual suspects as evidence of gold-market manipulation, I’ll now briefly address the question: Does the US monetary base drive the gold price?

Those who believe that the answer to the question is “yes” will sometimes show a chart like the one presented below to prove the correctness of their belief. Clearly, if you were armed only with this chart and the conviction that a substantial rise in the US MB should always go hand-in-hand with a rallying gold price, then you would likely take the happenings of the past two years as definitive evidence of artificial gold-price suppression. Of course, you would also have to put aside the fact that the gold price rose 300% from its 2001 low to its early-2008 peak with only a minor increase in the US MB, but this wouldn’t be a problem because it is always easy to come up with a fundamental reason for a large rise in the gold price. It’s only a large price decline that needs to be explained-away by a manipulation theory.

So, is gold’s divergence over the past two years from the on-going rise in the US MB strange or suspicious, such that it can be best explained by market manipulation?

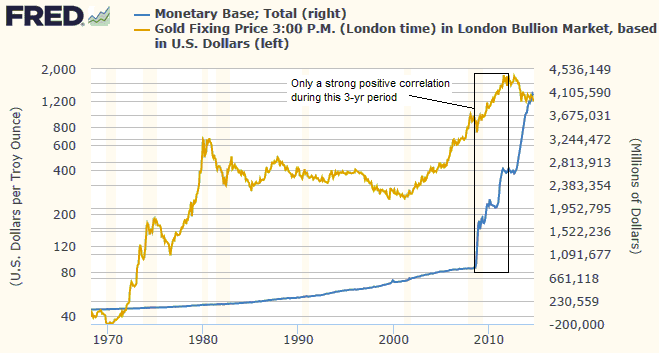
The answer is no. As is the case with the relationship between the gold price and the debt/GDP ratio, the visually-appealing positive correlation of the past several years disappears when the gold-MB relationship is viewed over a much longer timescale. Specifically, the following chart shows that the only period over the past 45 years during which there was a strong positive correlation between the gold price and the monetary base was the three-year period from late-2008 through to late-2011.

I wish that anticipating the performance of the US$ gold price were as easy as monitoring the US monetary base or the Fed’s balance sheet (the monetary base is controlled by the Fed via the expansion/contraction of its balance sheet), but unfortunately the gold market isn’t that simple. The reality is that like a rising debt/GDP ratio, a sharply rising monetary base can be a valid part of a bullish gold story. However, this is only to the extent that it helps to bring about lower real interest rates and/or a steeper yield curve and/or a weaker US dollar and/or rising credit spreads. It isn’t directly bullish.

I think that the first leg of the next substantial multi-year rally in the gold price will be linked to the Fed’s efforts to stabilise or contract the monetary base, because these efforts will expose the mal-investments of the past few years.

Print This Post Print This Post

How can ‘the Commercials’ be so dumb in the currency market and so smart in the gold market?

October 7, 2014

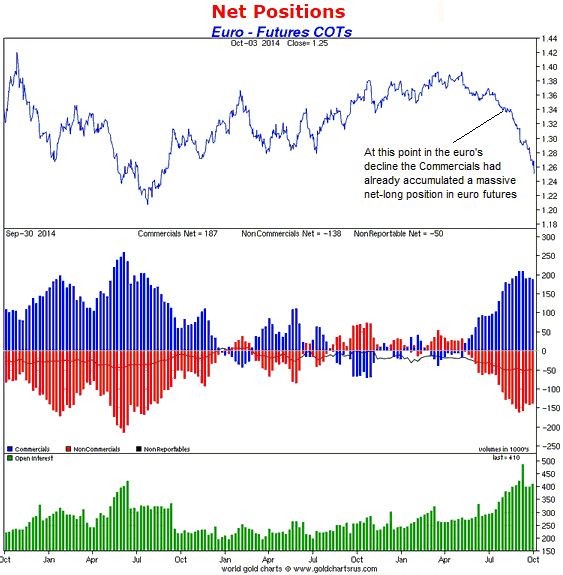
In June of 2012, when there appeared to be a serious threat that Europe’s monetary union would unravel, the Speculative net-short position and the offsetting Commercial net-long position in euro futures reached an all-time high. The following chart from Sharelynx.com shows that over the past two months the Speculative net-short and Commercial net-long positions got almost as high as their 2012 extremes, despite the absence of an existential threat to the euro.

The COT situation tells us that euro-related sentiment is ‘in the toilet’ and that there is a lot of speculative-short-covering fuel to power a euro rally. However, the main reason for including this chart is to show that the Speculative net-short and the Commercial net-long positions had already reached unusually high levels in August when the euro was trading at 1.34. This means that the bulk of the euro’s decline occurred AFTER the Commercials became massively net-long in the futures market. The question is: How could the Commercials be so dumb in the currency market and at the same time be so smart in the gold market?

The answer is that the Commercials are neither dumb in the currency market nor smart in the gold market. As I’ve explained in the past, the Commercial net-position in the futures market is simply a mathematical offset of the Speculative net-position, with Speculators being the driving force behind short-term price trends. The Commercials only appear to have been wrong based on their recent positioning in euro futures and right based on their recent positioning in gold futures because euro speculators (as a group) have recently been right and gold speculators (as a group) have recently been wrong.

It is also worth reiterating that the Commercial position in the futures market does not generally reflect the overall Commercial position. For example, a Commercial that is net-short in the futures market could be either flat or net-long when all positions are taken into account. In fact, a Commercial that establishes a large net-short position in the futures market is probably doing so BECAUSE it has a large net-long position to hedge in the cash market.

When the euro’s short-term trend reverses upward, the Speculators will be on the wrong side of the market and the Commercials will start to look right.

Print This Post Print This Post

The ECB’s monetary machinations

October 3, 2014

The ECB recently launched a two-pronged attack aimed at boosting bank lending to the private sector. These ‘prongs’ are the TLTRO (Targeted Longer Term Refinancing Operation), which got underway on 18th September, and the ABS (Asset Backed Security) and Covered Bond Purchase Program, which will soon get underway. Will these schemes be successful?

That depends on what constitutes success. The schemes cannot possibly foster economic progress, because creating money and credit out of nothing distorts price signals, redistributes wealth from savers to speculators and generally makes the economy less efficient. So, if success is defined as bringing about a stronger economy then failure is guaranteed. However, if success is defined as increasing the size of the ECB’s balance sheet by 1 trillion euros and adding 1 trillion euros to the money supply, then the schemes will probably, but not necessarily, be successful.

The challenge faced by the ECB as it tries to prod the commercial banks into lending more money to the private sector is the dearth of lending opportunities open to the banks. Due to the after-effects of the credit bubble that blew-up in 2008 and the ensuing years during which wealth was siphoned out of the real economy to prevent the holders of government bonds from suffering any losses (part of what we referred to back in 2010 as “the no bondholder left behind policy”), the euro-zone’s pool of willing and qualified private-sector borrowers has experienced severe shrinkage.

The new ABS purchase program is supposed to encourage the commercial banks to be more aggressive in their search for lending opportunities, in that the ECB is effectively saying “if you securitise it, we will buy it”. In other words, the ECB is effectively saying to the banks: “If you make new loans and bundle the loans into a security that can be sold, then you will definitely have a buyer for the security at an attractive price. You will therefore be able to shift the risk from your balance sheet to our balance sheet.” The extent to which the commercial banks will take advantage of this ‘generous’ offer is unknown.

The new ABS purchase program appears to have a better chance than the TLTRO of promoting increased bank lending to the private sector. The reason is that the ABS program enables banks to shift the risk of loan default to someone else (to the ECB and ultimately to tax-payers throughout the euro-zone), whereas the TLTRO is supposed to encourage banks to add risk to their own balance sheets. The TLTRO could still work, though, because the senior managements of banks are often guided by the same type of short-term thinking as most politicians. Just like the average politician is focused on doing/saying whatever it takes to win the next election, the average bank CEO is focused on doing whatever it takes to make the next quarterly and annual earnings reports look good.

Some analysts and commentators are concerned that the ECB’s new money-and-credit creation schemes won’t do enough to bring about the “inflation” that — according to their crackpot theories — the euro-zone needs. Therefore, they believe that the ECB should resort to Fed-style QE (outright large-scale monetisation of government bonds). This prompts me to address the question: Why hasn’t the ECB resorted to Fed-style QE? After all, it is blatantly obvious that Mario Draghi is as ignorant about economics as his Federal Reserve counterpart.

It’s first worth noting that the ECB does not appear to be facing a legal obstacle to the sort of QE programs implemented by the Fed. The ECB is legally prohibited from buying government bonds directly from any euro-zone government, but it is able to buy government bonds in the secondary market. In this respect it is in the same boat as the Fed. Like the ECB, the Fed is legally prohibited from buying US Treasury bonds directly from the US government, but it can buy as many Treasury bonds as it wants from Primary Dealers.

Rather than being legally constrained, the ECB appears to be politically constrained. Whereas some euro-zone governments and national central banks would be in favour of a full-blown QE program, other euro-zone governments and central banks, most notably the German government and the Bundesbank, would be very much against it. That’s why the ECB is coming up with half-measures. At this stage Draghi & Co. can’t get approval for the large-scale monetisation of government bonds, but they can get approval for a monetisation program that will supposedly result in additional credit to private businesses.

Lastly, if the ECB is determined to add 1 trillion euros to its balance sheet and the money supply over the coming 12 months then it will almost certainly find a way of doing so. If the ABS purchase program and the TLTRO don’t do the trick, then some other method will be concocted.

Print This Post Print This Post