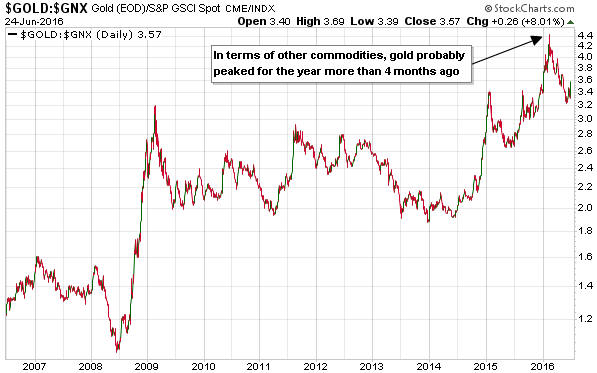
Gold has probably peaked for the year. Not necessarily in US$ terms, but in terms of other commodities.
In fact, relative to the Goldman Sachs Spot Commodity Index (GNX) the peak for this year most likely happened back in February. The February-2016 peak for the gold/GNX ratio wasn’t just any old high, it was an all-time high. In other words, at that time gold was more expensive than it had ever been relative to commodities in general.
Also worth mentioning is that when the US$ gold price spiked up to its highest level in more than 18 months as part of the “Brexit” mini-panic late last week, the rise in GNX terms was much less impressive. As illustrated below, last Friday’s move in the gold/GNX ratio looks more like a counter-trend bounce than an extension of the longer-term upward trend.
The February-2016 extreme in the gold/GNX ratio had more to do with the cheapness of other commodities than the expensiveness of gold, and the subsequent relative weakness in the gold price was mostly about other commodities making catch-up moves. This is actually the way things normally go at cyclical bottoms for commodities. The historical sample size is admittedly small, but it’s typical for gold to turn upward ahead of the commodity indices and to be a relative strength leader in the initial stage of a cyclical bull market. Gold then relinquishes its leadership.
Perhaps it will turn out to be different this time, but over the past 8 months the story has unfolded the way it should based on history and logic. An implication is that if the US$ gold price made a major bottom last December then the general commodity indices aren’t going to get any cheaper in US$ terms or gold terms than they were in January-February of this year.
Around cyclical lows, gold leads and the rest of the commodity world follows.
 Print This Post

