[This blog post is a modified excerpt from a recent TSI commentary]
At around this time last month we noted that the Fed had pushed the year-over-year rate of growth in US True Money Supply (TMS)*, also known as the US monetary inflation rate, to a multi-year high of 11.3%, and that based on what the Fed subsequently had done the monetary inflation rate could reach 15%-20% by the middle of this year. With the monthly monetary data for April having been published last week, we now know that the aforementioned range has been reached already. As illustrated below, as at the end of April the US monetary inflation rate was close to 20%. Next month’s rate should be even higher.
This is banana-republic-style money creation, although it isn’t unprecedented for the US. The above chart shows that a near-20% monetary inflation rate also was attained in January-2002. Back then it was the bursting of the stock market bubble followed by the 9/11 attacks that caused the Fed to panic and flood the financial system with new money.
In a way, the shock to the financial markets resulting from the attacks by terrorists in September-2001 is similar to the shock to the financial markets resulting from the COVID-19 lockdowns. That’s despite the huge differences in the economic ramifications (the damage inflicted on the overall economy by the 9/11 attacks was minor and short-term, whereas the damage inflicted on the overall economy by the virus-related lockdowns of 2020 will prove to be major on both a short-term basis and a long-term basis).
The similar reactions of the financial markets (most notably the stock market) to the events of 2001 and 2020 firstly can be put down to the fact that both situations involved a sudden increase in uncertainty. Investors and speculators knew that the world had changed for the worse, but were ‘in the dark’ regarding many of the details. Secondly, in both cases there was an immediate and aggressive attempt by policy-makers to ‘reflate’.
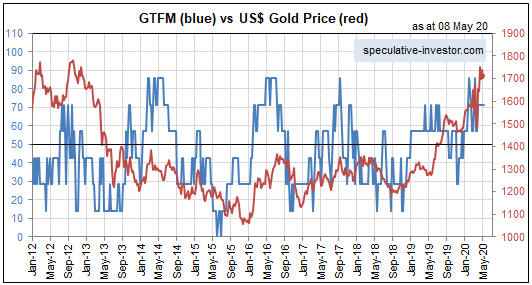
Some of the results of this year’s monetary inflation moonshot should be similar to the results of the 2001 episode. In particular, this year’s explosion in the supply of US dollars should lead to a weaker US$ on the foreign exchange market (the Dollar Index commenced a multi-year bearish trend in January-2002 and probably will do the same within the next few months), a higher gold price, higher commodity prices and — eventually — higher equity prices.
The most important difference is that over the years ahead the economy will stay weak and, as a result, the unemployment rate will stay high. This is because flooding the economy with new dollars not only does nothing to make up for the destruction of real wealth caused by the lockdowns, it gets in the way of wealth creation by falsifying price signals and keeping ‘zombie companies’ alive.
*TMS is the sum of currency in circulation, demand deposits and savings deposits. It does not include bank reserves, time deposits or money market funds.
 Print This Post