[This blog post is an excerpt from a commentary published at www.speculative-investor.com last week]
We wrote in the latest Weekly Update that the Moody’s downgrade of US sovereign debt probably wouldn’t have any effect beyond a knee-jerk reaction, because the downgrade wasn’t significant new information. Prompted by the big deal that was made in the press over this virtual non-event, we thought that it was worth outlining what does and does not matter for the long end of the US Treasury market. We’ll start by listing some of the things that do NOT matter.
First, the so-called “debt wall” does not matter. When you look at a chart showing the amount of US government debt that will have to be refinanced every month or every quarter for the next several years, there always will appear to be a ‘wall’ of debt that has to be refinanced over the coming 12 months. This simply is a function of the fact that 25%-35% of the total debt constitutes T-Bills (debt securities that mature within a year). It is not significantly different today than it was at any time over the past 10 years and it most likely won’t be significantly different at any time over the next few years. On a related matter, almost everyone with a substantial T-Bills holding automatically rolls the position when the old bills mature, so it’s not like the US government constantly is having to find new buyers for its debt.
Second, the Fed staying tighter for longer does not matter, or at least is not bearish, for the long end of the Treasury market, because the Fed staying tighter for longer reduces both the actual and the perceived risk of “inflation”. In fact, at a time when inflation fears are elevated due to what has happened in recent years, it could be more of a plus than a minus.
Third, large-scale selling of Treasury securities by foreign governments is not a serious threat. Foreign governments (via their central banks) buy and sell US government debt securities primarily to manipulate the exchange rates of their own currencies. This involves selling US treasuries when the US$ is strong, with the aim of propping-up the local currency, and buying US treasuries when the US$ is weak, with the aim of preventing the local currency from becoming excessively strong. We see no reason to expect that the trade war initiated by the US will change this method of managing FX reserves.
We’ll now mention some of the things that do matter, that is, some of the legitimate concerns if you happen to own long-dated treasuries.
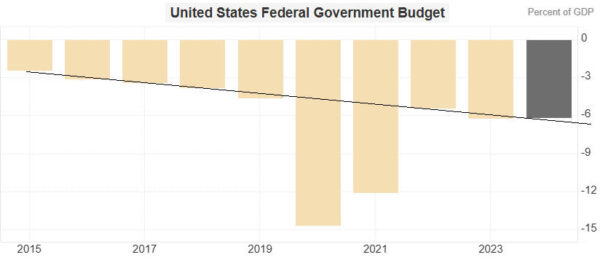
The main concern is the fiscal deficit. This is not only because a large fiscal deficit results in a large increase in the supply of new government debt securities, but also because a large fiscal deficit generally will lead to higher “inflation” by diverting savings from the relatively efficient private sector to the relatively wasteful public sector. The worst-case scenario is a fiscal deficit that is both large and increasing as a percentage of the economy.
With reference to the following chart, if we ignore the Covid-related extremes of 2020-2021 we can see that the US federal deficit is large and steadily increasing as a percentage of nominal GDP (the downward trend on the chart reflects a rising deficit/GDP ratio). Moreover, the budget bill that currently is making its way through the US parliament would all but guarantee the continuation of the adverse trend, because this bill front-loads tax cuts and back-loads spending cuts. This is a good reason to expect lower T-Bond prices and higher T-Bond yields over the years ahead.
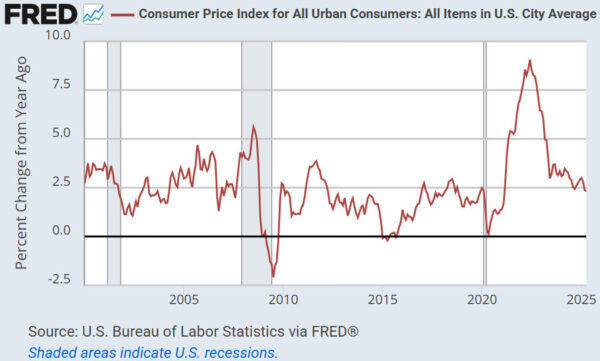
Another valid concern is the inflationary effects of tariffs. The tariffs that Trump seems determined to impose could lead to an upward ‘blip’ in the popular measures of inflation within the next several months, but the more important longer-term effect is that they will reduce the dollar’s purchasing power by making the economy less efficient. This is a secondary reason to expect higher bond yields over the years ahead.
A third valid concern doesn’t apply right now, but it’s likely that when coincident and lagging economic data clearly signal “recession” the Fed will again take actions designed to rapidly boost the money supply. There’s a high probability that this will happen at a time when the government’s deficit is growing rapidly due to the combination of declining tax revenue and rising costs associated with government support and stimulus programs, leading to an inflation surge.
Summing up, some of the reasons to be bearish on the T-Bond that often get mentioned are not valid, but there are some very good reasons to be bearish, at least beyond the short-term. In particular, currently there appears to be no political will to end the deficit spending or even to cap the deficit’s growth rate, which means that any limits will have to be imposed by the bond market. This would be done via higher bond yields.
 Print This Post

