Blog 2 Columns

New Recession Warnings

November 22, 2023

[This blog post is an excerpt for a commentary published at speculative-investor.com on 19th November 2023]

There was a government-spending-fuelled burst of economic activity in the US during the third quarter of this year that led to a high GDP growth number being reported for the quarter, but signs of weakness are now appearing in coincident economic indicators.

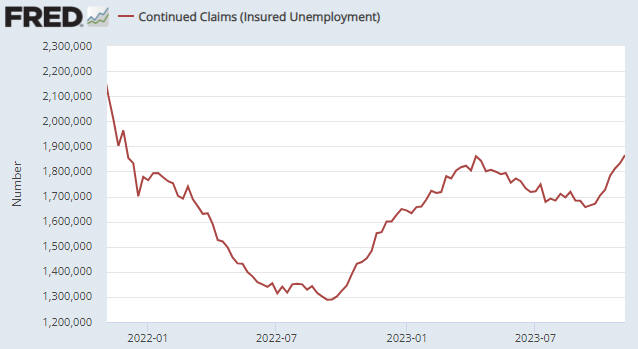
The most important of the aforementioned signs is the rise in Continuous Claims for Unemployment Insurance. With reference to the following weekly chart, Continuous Claims bottomed in September-2022, moved higher into April of this year, dropped back to a higher low during September and has just confirmed an upward trend by moving above its April-2023 high. This is consistent with our view that a US recession will begin before the end of this year, although based on the historical record the recession start date won’t become official until the second half of next year.

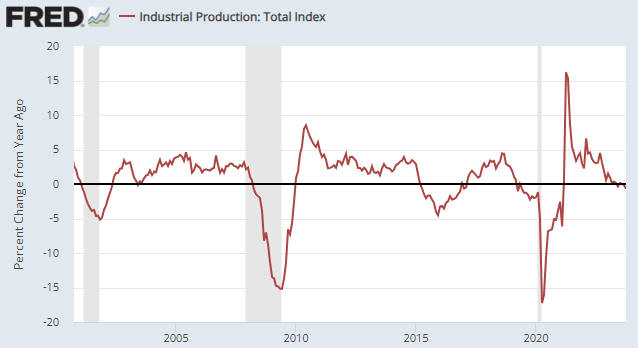
Another sign is the decline in the year-over-year (YOY) growth rate of Industrial Production (IP) to negative 0.70%, the lowest level since February-2021. The YOY growth rate of IP in October-2023 is similar to where it was in the month before the start of the 2001 recession and is well below where it was at the start of the 2007-2009 recession. Below is a chart of this coincident economic indicator.

It probably will be many months before the US coincident economic data become consistently weak. In the meantime, we expect to see — and should see, if our current outlook is correct — a gradual increase in the proportion of economic statistics that are worse than generally expected. We also expect to see a gradual shift away from the “soft landing” narrative (the belief that the US economy will make it through the monetary tightening without a recession) towards the recession narrative.

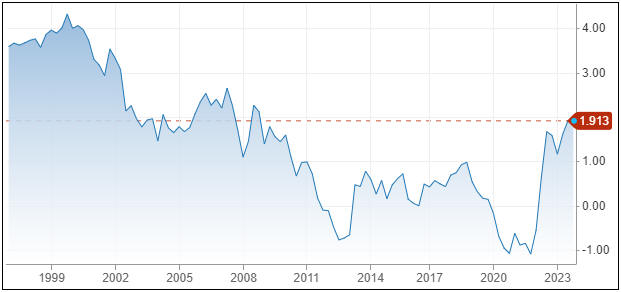
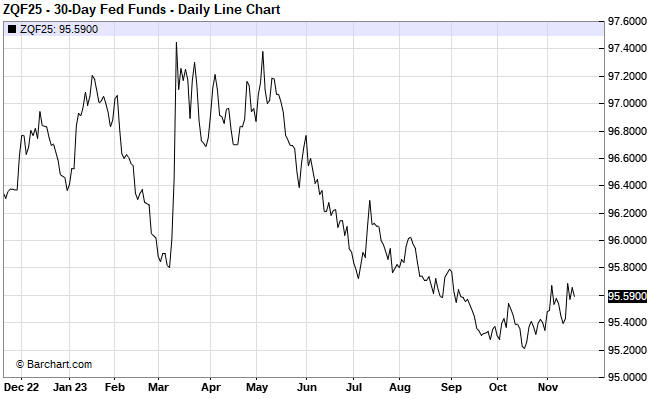
A few weeks ago (refer to the 30th October Weekly Update) we noted early signs that the financial world was starting to move away from the soft landing scenario. One of the indicators that we are tracking to check that this shift remains in progress is the January-2025 Fed Funds Futures (FFF) contract, a daily chart of which is displayed below. Note that the line on this chart moves in the opposite direction to interest rate expectations.

The substantial downward move on this chart from early-May through to mid-October reflects a major increase in the popularity of the soft landing scenario, while the relatively small upward move over the past few weeks is tentative evidence that a shift towards general belief in a less innocuous economic outcome has begun.

At this time, the soft landing narrative remains dominant. That’s why the SPX has rebounded to within 2% of its high for the year and the January-2025 FFF contract has retraced only a small part of its May-October decline. However, we expect that belief in a soft landing will dissipate over the next six months, leading to a substantial decline in the stock market and a substantial rise in the US$ gold price.

Print This Post Print This Post

Why junior gold mining stocks have performed so poorly

November 16, 2023

[This blog post is a brief excerpt from a recent commentary published at speculative-investor.com]

Why has the junior end of the gold mining world performed so poorly over the past two years. In particular, why has it performed so poorly over the past 12 months in parallel with a relatively strong gold market?

Understanding why begins with understanding that in the absence of a mining operation that can be used to PROFITABLY extract it from the ground, gold in the ground has option value only. The option could be valued by the market at almost zero or a lot depending on many factors, the most important variable being the public’s desire to speculate. Furthermore, a gold mining operation that generates losses year after year also has option value only, with the public’s desire to speculate again being the most important determinant of the option’s market value.

In other words, with the relatively illiquid stocks it comes down to the general public’s desire to speculate.

Hedge funds usually will focus on gold mining ETFs or the larger-cap gold stocks because they need the liquidity. Wealthy professional investors such as Eric Sprott typically will take positions via private placements with the aim of eventually exiting via a liquidity event such as a takeover. It’s the general public that determines performance at the bottom of the food chain and over the past two years the public has become progressively less interested in speculating. Hence, the market values of stocks with option value only have become a lot cheaper.

Although during the course of this year we have suggested directing most new buying in the gold sector towards profitable producers, we are still interested in gold stocks that have option value only. These are the stocks that will generate by far the largest returns after the general public starts getting interested in the sector. However, sparking that interest probably will require a minimum of all-time highs in the US$ gold price and gold mining indices such as the HUI breaking above their H1-2023 highs, which probably won’t happen until the first half of next year. In fact, based on the historical record, sparking the general public’s interest in speculative gold mining stocks could require the broad stock market to begin discounting the combination of a recovery from recession and much easier monetary conditions, which possibly won’t happen until the first half of 2025.

Until then, most (not all) new buying in the gold sector should be directed towards profitable producers, that is, towards the stocks of real businesses. But, only when they are oversold or consolidating. Don’t get excited and buy them after they have just gone up a lot.

Print This Post Print This Post

Peak “Soft Landing”?

November 3, 2023

[This blog post is an excerpt from a commentary published at speculative-investor.com on 29th October 2023]

Thanks largely to rapid government spending, inventory building by the private sector and about $500B coming out of the Fed’s Reverse Repo (RRP) Facility, US ‘real’ GDP grew at an annualised rate of almost 5% in Q3-2023. The GDP number included strong quarterly growth in Real Gross Private Domestic Investment (RGPDI), which could be explained in part by investment incentivised by the Federal government’s misnamed “Inflation Reduction Act”. What are the implications for the financial markets of this economic activity surge?

With one important exception, all of the implications are in the past. It has been known for a few months that the GDP growth number for Q3 would be high, meaning that a high number was factored into market prices well before last week’s news. To the financial markets, what matters now is what’s likely to happen to economic activity over the quarters ahead.

We suspect that the GDP growth number that gets reported for the final quarter of this year will look fine, partly because money is coming out of the RRP Facility at a rapid rate (about $450B came out over just the past four weeks) and partly because the US federal government will continue spending as if there were no tomorrow. However, it’s likely that much weaker numbers will be reported during the first half of 2024 due to the lagged effects of monetary tightening, the exhaustion of the RRP liquidity channel, the effects on the US economy of recession in Europe, and reduced consumer spending in response to declining asset prices (stocks and real estate).

The one important exception mentioned above is the potential effect of the just-reported high GDP growth number on the future actions of the Fed. In particular, even if it is likely that the rate of GDP growth will be significantly lower in Q4-2023 and turn negative during H1-2024, the Fed tends to look backward and therefore could be encouraged by last quarter’s strong growth to stay tighter for longer.

It turned out, however, that during the hours following last Thursday’s announcement of the strong GDP growth number the expectations of the Fed Funds Futures (FFF) market shifted in a ‘dovish’ direction. Specifically, according to this market, last Thursday the probability of another Fed rate hike before year-end dropped from around 29% to around 20% and the expected Fed Funds Rate at the end of next year fell from 4.68% to 4.60%.

The market responses to last week’s strong US GDP number and generally good news on the corporate earnings front could be early signs that the financial world is beginning to move away from the “soft landing” scenario (the idea that the US economy will avoid a recession). This is to be expected, in that every recession begins as a soft landing and then turns into something more painful. The timing is usually difficult to pin down, though, because on the way to a recession there invariably are many twists and turns.

Print This Post Print This Post

What do the markets believe about the war?

October 28, 2023

[This blog post is an excerpt from a commentary published at www.speculative-investor.com on 25th October 2023]

We aren’t geopolitical experts and do not know how the Israel-Hamas war will unfold*. Nobody does. There are far too many unknowns at this stage for even the geopolitical experts to do anything other than guess. What we are able to do is figure out what the markets are discounting, that is, what the majority of market participants currently believe will happen. Today’s assessments of how the conflict will play out may turn out to be wrong and therefore could necessitate large price adjustments in the future, but when deciding what to do in the markets it is important to know what’s currently priced in. Here’s what we think is priced in right now:

1) The oil market

At the time of the Hamas attack on Israel the oil market was slightly oversold due to a price plunge over the preceding week. Consequently, at least a countertrend rebound was likely regardless of news.

During the three trading days after the war news hit the wires (9th-11th October), the oil price bounced and then pulled back. We wrote in the 11th October Interim Update that this price action suggested an expectation among large oil traders that the conflict would not broaden or that if it did broaden then Saudi Arabia would act to offset any loss of oil from Iran.

The subsequent price action indicates that the oil market has not ‘changed its mind’. We say this because the rebound in the oil price from its pre-war-news low looks more like a countertrend reaction than the start of a move to above the September-2023 high. Also, the extent of the backwardation in the oil futures market has decreased over the past week, which suggests less urgency to stock-up on physical oil.

In summary, the oil market does not believe that the war will have a significant negative effect on global oil supply.

2) The gold market

Prior to the war news hitting the wires the gold market was very oversold in both momentum and sentiment terms and therefore was poised for a rebound. As a result of the war news, the rebound has been much stronger than it otherwise would have been.

The performance of the US$ gold price indicates that large speculators initially were uncertain as to how big the war would become. Would it be confined to Israel versus Hamas in/around Gaza, or would it expand to encompass direct involvement from the US and Iran? Also, how much additional US government spending would result from the war in the Middle East and how would this spending affect the resources directed towards the NATO-Russia war in Ukraine?

At the moment large speculators in the gold market believe that these are open questions, with a substantial expansion of the war being one of the more likely scenarios. That’s a reasonable conclusion because the gold price continues to hover around resistance at US$1980-$2000 — about $180 above where it was three weeks ago.

We’ll know that the perceived level of uncertainty/risk has increased significantly if the gold price breaks above US$2000. By the same token, we’ll know that the perceived level of uncertainty/risk has begun to wane when there is a clear downward reversal in the US$ gold price. Note that a downward reversal in the US$ gold price is likely to precede a turn for the better in the news from the Middle East.

3) The stock market

In the US stock market, the war has prompted a shift away from risk but has been very much a secondary issue. The primary issue is the downward trend in the bond market (the upward trend in long-dated Treasury yields).

4) The currency market

In early-October the Dollar Index (DX) was very overbought and had just begun to ‘correct’. The war news may have reduced the magnitude of the correction, but up until now has not been sufficient to propel the DX above its early-October high.

As far as we can tell, according to the currency market the outbreak of war in the Middle East has increased the attractiveness of the US$ relative to other fiat currencies but also added to concerns about the pace at which the US government is going into debt. Putting it another way, what’s priced into the currency market at the moment is both the uncertainty regarding the outcome of the war and the offsetting consideration that the war is increasing the risk of a US government debt spiral.

Summarising all of the above, the oil market is not concerned about a significant supply disruption, the gold market has priced-in considerable uncertainty/risk and could price-in more of the same before reversing, the US stock market is more concerned about bond yields than about the Middle East, and the currency market thinks that the benefits of holding the US$ in a period of increasing geopolitical instability are being mostly offset by the likelihood that a further increase in geopolitical instability would accelerate the already rapid pace of US government deficit-spending.

*As is always the case these days when major geopolitical events occur, many people quickly become ‘experts’ as a result of the large volume of information that suddenly becomes available over the internet. People who a month ago could not have identified Gaza on a map and knew nothing about the history of Hamas are now ‘experts’ who can confidently explain why the events have occurred and what’s going to happen. The actual experts, on the other hand, know that there are a lot of unknowns and therefore that the outcome is uncertain.

Print This Post Print This Post

US recession to start before year-end

October 11, 2023

[This blog post is an excerpt from a commentary published at https://speculative-investor.com/ last week]

There is currently a major divergence within the US economy. Over the past 12 months industrial production has been flat and the ISM Manufacturing Report has been warning of imminent recession, but according to GDP calculations and forecasts the economy has grown and will continue to grow at a healthy pace (US GDP grew at a 2.1% annualised pace in Q2-2023 and is projected to have grown at a faster pace in Q3-2023). Furthermore, despite the warnings from reliable leading indicators, the dominant view now is that there will be a “soft landing” (a slowdown, but no recession). Before discussing what’s behind this divergence we’ll review the current messages from some of our favourite leading recession indicators.

First, the ISM Manufacturing New Orders Index (NOI) bounced during September-2023, but its overarching message continues to be that a recession will begin within the next few months. It would have to rise to 55 to cancel the recession warning.

Second, the following chart of the 10year-3month yield spread shows that although the US yield curve remains inverted to an extreme (the yield curve is inverted when the line on this chart is below zero), there has been a reversal from flattening/inverting to steepening. The reversal from flattening/inverting to steepening is a recession warning signal, meaning that the yield curve is now sending the same signal as the NOI.

Muddying the waters is the fact that the yield curve’s reversal has been driven by a rising long-term yield, whereas the reversal to steepening that precedes a recession usually is driven by a falling short-term yield. However, we will take the signal at face value as it is not unprecedented for the initial steepening to be caused by the long-term yield rising faster than the short-term yield.

Third, here is a chart of the Conference Board’s Leading Economic Index (LEI). This chart shows that the LEI has fallen by 10.5% from its peak and that 20 months have gone by since the peak.

In the more than 60 years covered by this chart, the LEI has never suffered a peak-to-trough decline of 10.5% without the economy having entered recession and the LEI has never declined for longer than 20 months from its peak without the economy having entered recession. Assuming that the economy is not in recession today (a reasonable assumption given the coincident data), this implies that with respect to the LEI’s messaging the economy is now in uncharted territory.

The US economy is not in recession today, but taken together the above leading indicators suggest a high probability of a recession getting underway before year-end. This doesn’t mean that recessionary conditions will become obvious to most analysts and economists before year-end, though, because recession start/finish dates are determined well after the fact and because in real time the economy can appear to be doing OK during the first few months of a recession.

Returning to the question we asked in the opening paragraph, the robust economic activity still evident in some statistics, chief among them being the GDP numbers, is most likely the result of rapid government spending. This is causing the parts of the economy that are impacted the most by government spending, such as anything linked to the military or the ridiculously-named “Inflation Reduction Act”, to be strong while other parts of the economy are weak.

As an aside, due to the way GDP is calculated it can be boosted by wealth-destroying activities. For a hypothetical example, if the US government were to pay a million people $1000 each to dig a hole and then another $1000 to fill it in, 2 billion dollars would be added to US GDP. For an actual example, the on-going destruction of Ukraine is adding to US GDP because it is increasing US production of military equipment and all of the parts/materials that go into the equipment.

If the current cycle ends up being unprecedented in terms of the time from leading indicator warnings of recession to the actual start of a recession, we think that it will be due to the federal government doing aggregate-demand-boosting spending much sooner than usual during the cycle. This could delay the start of a recession to beyond the historical range, but only by creating the conditions for a government debt spiral.

Print This Post Print This Post

Timing the coming US recession

September 12, 2023

[This blog post is an excerpt, with a couple of minor tweaks, from a commentary published at www.speculative-investor.com last week]

With regard to US economic indicators, very little has happened over the past three months. Coincident data have become weaker but not dramatically so, while there have been no significant changes in the most important leading indicators of recession. The overarching message from the data is that the US economy is not far from recession, although it is clear that the tipping point has not yet been reached. However, there has been a pronounced change in sentiment, with the view that a recession will be avoided (the soft-landing or no-landing expectation) becoming dominant.

Turning to the data, as usual we’ll note the current positions of the ISM Manufacturing New Orders Index (NOI) and the yield curve, two of our favourite leading recession indicators.

The following monthly chart shows that the NOI remains at a level (below 48) that in the past usually pointed to the US economy being either in recession or about to enter recession.

Note, as well, that while the NOI generated a couple of false recession warnings in the past, the only period since 1970 during which the NOI spent several months below 48 with no recession was in 1995. It’s very unlikely that we are dealing with a 1995 scenario, though, because at that time public and private debt levels were relatively low and the Fed stopped tightening well before the yield curve became inverted.

Speaking of the yield curve, the following chart shows that the 10year-3month yield spread remains inverted to an extreme (the yield curve is inverted when the line on this chart is below zero). This tells us that monetary conditions have become tight enough to virtually guarantee an official recession. However, the signal that a recession is imminent is a reversal of the yield curve from flattening/inverting to steepening, which is yet to happen.

Note that the mild steepening that occurred over the past two months appears to have been driven by concerns about the speed at which the US government will be going into debt. We don’t view this as the sort of steepening that warns of imminent recession.

It is very unusual for the NOI to spend so much time in recession territory (11 months and counting at this stage) without conclusive evidence of recession appearing in the coincident economic data, but the time from yield curve inversion to the present is still well within the historical range. We are referring to the fact that since the late-1960s, the time from the 10y-3m yield spread becoming inverted to the start of an official recession typically has been 8-12 months, with a minimum of 5 months and a maximum of 17 months. The 10y-3m yield spread became inverted in October of last year, so the typical historical lead-time points to June-October of this year and the maximum historical lead-time points to March of next year for the start of a recession.

One of the most useful economic indicators is the average credit spread as represented by the High Yield Index Option Adjusted Spread (HYIOAS). The HYIOAS is a coincident indicator of the US economy and a leading indicator of recession, in that by the time the US economy has become weak enough to enter recession territory there usually will have been a significant widening of credit spreads as evidenced by a rapid rise in the HYIOAS. Referring to the following chart, for example, notice the upward moves in the HYIOAS during the months leading up to the 2001 and 2007-2009 recessions.

The sort of up-move in the HYIOAS that would be consistent with the lead-up to a recession occurred during March-June of last year, but the economy then rebounded and since June of last year the HYIOAS has been trending downward. This downward trend in the HYIOAS is indicative of an upward trend in economic confidence.

The HYIOAS currently is near a 16-month low, which is NOT consistent with an imminent recession start. If a recession is going to begin within the next few months, a sizable up-move in the HYIOAS should begin soon.

In conclusion, although most data are consistent with the US economy being on the verge of recession, the low level of the HYIOAS and the lack of a yield curve reversal imply that the recession start is still at least three months away.

Print This Post Print This Post

Gold and ‘real’ US interest rates

August 31, 2023

[This blog post is an excerpt from a commentary published at speculative-investor.com on 27th August 2023]

We’ve noted in previous commentaries how well the US$ gold price has held up given the rise in real US interest rates as indicated by the 10-year Treasury Inflation Protected Securities (TIPS) yield. We are referring to the fact that the 10-year TIPS yield, a long-term chart of which is displayed below, made a 14-year high of 2.00% early last week before pulling back a little, whereas the US$ gold price has retraced less than half of its up-move from its Q4-2022 low. We often say that everything is linked, and in this case the likely linkage (the explanation for gold’s resilience) is the nature of the recent T-Bond sell-off.


Chart Source: https://www.cnbc.com/quotes/US10YTIP

As discussed in last week’s Interim Update, meaningful declines in the T-Bond price over the past few decades generally have been driven by rising inflation expectations and/or the Fed’s rate-hiking. They generally have NOT been driven by accelerating supply growth or concerns about the same. The main reason is that in the past the T-Bond supply tended to ramp up in parallel with economic and financial market conditions that prompted a substantial increase in the desire to hold T-Bonds, so much so that the increase in demand for the perceived safety provided by Treasury debt trumped the increase in the supply of this debt.

The recent past has been different, in that the decline in the T-Bond price over the past four months and especially over the past month was not driven by changing expectations regarding inflation or the Fed’s monetary tightening. We know that this is the case because the “inflation” rates factored into the TIPS market (what we sometimes refer to as the “expected CPI”) have been stable, as were the prices of the most relevant Fed Funds Futures contracts prior to the past few days. Instead, the main driver was concerns about the pace at which the supply of government debt will grow over the coming year due to current spending plans, rapidly rising interest expense, and a likely large increase in government deficit-spending after the economy slides into recession. This difference matters to the gold market.

The recent increase in the ‘real’ yield on Treasury bonds has not been as bearish for gold as it normally would be, because the concerns about the US fiscal situation that have been driving the T-Bond price downward and the real T-Bond yield upward also have been boosting the investment demand for gold. We suspect that this is not so much due to the rapid increase in the government’s indebtedness in and of itself, but due to the eventual economic and monetary consequences of the burgeoning government debt.

The eventual economic consequences include slower growth as more resources get used and allocated by the government. A likely monetary consequence is that regardless of what senior members of the Fed currently say and think (they naturally will insist that the Fed is independent), there’s a high probability that the Fed eventually will be called upon to help finance the government.

Print This Post Print This Post

The gold sector is approaching a cycle low

August 15, 2023

It is worth paying close attention when a market trends into a period during which a turning point is likely based on historical cyclicality. The gold mining sector has just entered such a period.

We are referring to the strong tendency of the gold mining sector, as represented by the Gold Miners ETF (GDX), to make its high or its low for the year during August-September. Specifically, this period contained the low for the year in 2015, the high for the year in 2016 and 2017, the low for the year in 2018, the high for the year in 2019 and 2020, and the low for the year in 2021 and 2022. In other words, the August-September period ushered in the annual high or the annual low in each of the past eight years.

The vertical red lines on the following weekly GDX chart mark the aforementioned August-September turning points.

GDX_cycle_150823

We have been following the gold mining sector’s August-September cycle at speculative-investor.com for several years now. At the start of a year there will be no way of knowing whether that year’s August-September period will contain an important high or low, but there usually will be clues by June. By mid-June of this year it was apparent that if the August-September cycle was still in effect then it would mark an important low, that is, a turn from down to up. Subsequent price action has continued to point to an August-September low.

The 12-month cycle low could be set at any time over the next few weeks, but to create maximum potential for the ensuing rally it ideally will be set after the March-2023 low has been tested or breached.

Print This Post Print This Post