Gold and ‘real’ US interest rates

Print This Post Print This Post

Gold and ‘real’ US interest rates

[This blog post is an excerpt from a commentary published at speculative-investor.com on 27th August 2023]

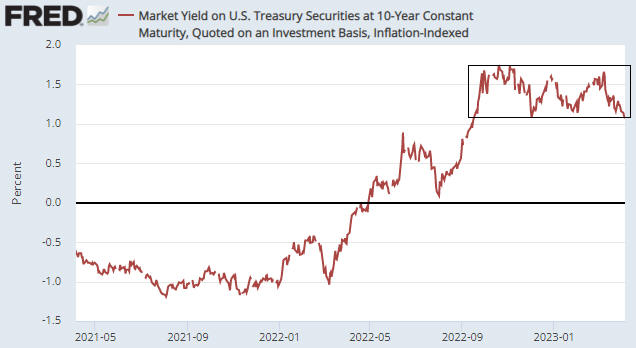
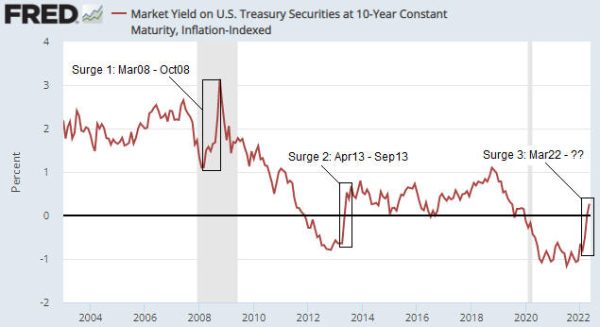
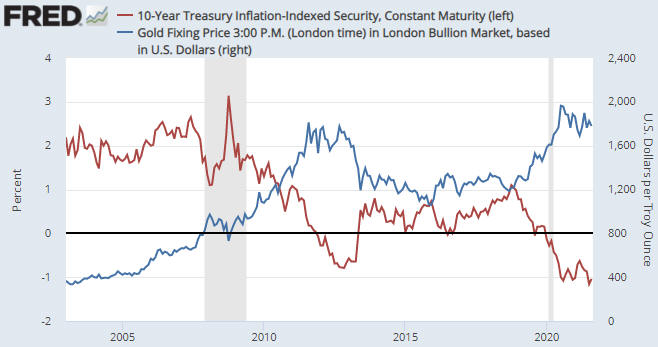
We’ve noted in previous commentaries how well the US$ gold price has held up given the rise in real US interest rates as indicated by the 10-year Treasury Inflation Protected Securities (TIPS) yield. We are referring to the fact that the 10-year TIPS yield, a long-term chart of which is displayed below, made a 14-year high of 2.00% early last week before pulling back a little, whereas the US$ gold price has retraced less than half of its up-move from its Q4-2022 low. We often say that everything is linked, and in this case the likely linkage (the explanation for gold’s resilience) is the nature of the recent T-Bond sell-off.


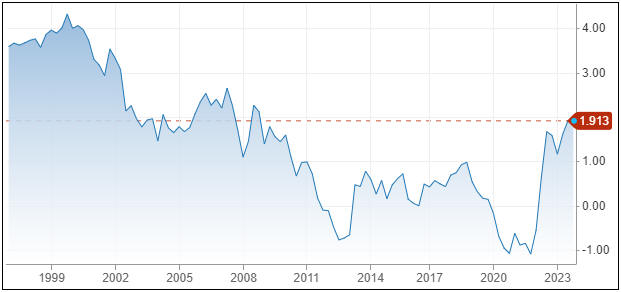
Chart Source: https://www.cnbc.com/quotes/US10YTIP

As discussed in last week’s Interim Update, meaningful declines in the T-Bond price over the past few decades generally have been driven by rising inflation expectations and/or the Fed’s rate-hiking. They generally have NOT been driven by accelerating supply growth or concerns about the same. The main reason is that in the past the T-Bond supply tended to ramp up in parallel with economic and financial market conditions that prompted a substantial increase in the desire to hold T-Bonds, so much so that the increase in demand for the perceived safety provided by Treasury debt trumped the increase in the supply of this debt.

The recent past has been different, in that the decline in the T-Bond price over the past four months and especially over the past month was not driven by changing expectations regarding inflation or the Fed’s monetary tightening. We know that this is the case because the “inflation” rates factored into the TIPS market (what we sometimes refer to as the “expected CPI”) have been stable, as were the prices of the most relevant Fed Funds Futures contracts prior to the past few days. Instead, the main driver was concerns about the pace at which the supply of government debt will grow over the coming year due to current spending plans, rapidly rising interest expense, and a likely large increase in government deficit-spending after the economy slides into recession. This difference matters to the gold market.

The recent increase in the ‘real’ yield on Treasury bonds has not been as bearish for gold as it normally would be, because the concerns about the US fiscal situation that have been driving the T-Bond price downward and the real T-Bond yield upward also have been boosting the investment demand for gold. We suspect that this is not so much due to the rapid increase in the government’s indebtedness in and of itself, but due to the eventual economic and monetary consequences of the burgeoning government debt.

The eventual economic consequences include slower growth as more resources get used and allocated by the government. A likely monetary consequence is that regardless of what senior members of the Fed currently say and think (they naturally will insist that the Fed is independent), there’s a high probability that the Fed eventually will be called upon to help finance the government.

Print This Post Print This Post

Gold and Real Interest Rates

[This blog post is an excerpt from a commentary published at TSI on 9th April]

The following chart shows that the yield on the 10-year Treasury Inflation-Protected Security (TIPS), a proxy for the real long-term US interest rate, has oscillated within a horizontal range over the past seven months. These interest rate swings may not appear to be significant, but they have had significant effects on the financial markets in general and the gold market in particular.

With regard to the effects on the gold market of the recent swings in the 10-year TIPS yield, we note that:

1. The multi-year high recorded by the 10-year TIPS yield on 3rd November of last year coincided with the end of a multi-year downward correction in the US$ gold price.

2. The short-term low in the 10-year TIPS yield on 1st February of this year coincided with a short-term peak in the US$ gold price.

3. The short-term high in the 10-year TIPS yield on 8th March coincided with the end of a short-term correction in the US$ gold price.

4. The US$ gold price rocketed upward from 8th March through to the end of last week as the 10-year TIPS yield moved back to the bottom of its range.

With the 10-year TIPS yield now at the bottom of its 7-month range, the most likely direction of the next multi-week move is upward. However, at some point there will be a sustained breakout from this range, with major consequences for the financial markets.

If the eventual breakout in the 10-year TIPS yield is to the upside, it will be bearish for everything except the US dollar. This is a low-probability scenario because it would require the Fed to either continue its monetary tightening in the face of severe economic weakness or take no action when presented with obvious evidence of deflation.

If the eventual breakout in the 10-year TIPS yield is to the downside, the consequences for asset and commodity prices will depend on whether the primary driver of the breakout is a falling nominal yield or rising inflation expectations (the real interest rate is the nominal interest rate minus the EXPECTED inflation rate). A downside breakout in the real interest rate that was driven by a falling nominal yield would be bullish for gold and probably also would be bullish for the US$ relative to other major currencies, while being bearish for most commodities and equities. This is because it likely would result from severe economic weakness. A downside breakout in the real interest rate that was driven by rising inflation expectations would be bullish for gold, but more bullish for cyclical commodities (e.g. the industrial metals) and equities. It would be bearish for the US$.

We expect that at some point within the next four months the 10-year TIPS yield will make a sustained break below the bottom of its range, primarily due to falling nominal interest rates. It could happen as soon as this month, but July-August is a more likely timeframe. It mainly depends on how quickly the economy deteriorates.

Print This Post Print This Post

The coming plunge in short-term interest rates

[This blog post is an excerpt from a recent TSI commentary]

Market interest rates always lead Fed-controlled interest rates at important turning points. Therefore, when trying to figure out whether interest rates have peaked or troughed, don’t look at what the Fed is saying; look at what the markets are saying.

The above statement is illustrated by the following chart comparison of the Fed Funds Rate (the green line), an overnight interest rate totally controlled by the Fed, and the 2-year T-Note Yield (the blue line), a short-term interest rate that is influenced by the Fed but ultimately determined by the market. The chart shows that at cyclical trend changes since the mid-1990s, the 2-year T-Note yield always changed direction in advance of — usually well in advance of — the Fed Funds Rate (FFR). For example, focusing on the downward trend changes we see from the chart that a) the 2-year yield reversed downward in Q4-2018 and the FFR followed in mid-2019, b) the 2-year yield reversed downward in mid-2006 and the FFR followed in mid-2007, and c) the 2-year yield reversed downward in Q2-2000 and the FFR followed in Q4-2000. When the 2-year T-Note yield reversed downward in 2018, 2006 and 2000, the Fed had no idea that within 6-12 months it would be slashing the FFR.

Right now, J. Powell thinks that the Fed is going to hike its targeted interest rates 2-3 more times and then hold them at 5% or more until well into 2024. However, that’s nothing like what the Fed will do if the stock market, the GDP growth numbers, the CPI and the employment data do what we expect over the next few quarters.

Our view is that the US stock market and economy are about to tank due to the decline in the monetary inflation rate that has already occurred, causing market interest rates to fall across the yield curve. Furthermore, the longer it takes for the Fed to wake up to what’s going on, the worse it will be for both the stock market and the economy and the more rapid will be the decline in market interest rates.

The Fed is asleep, but the market has begun to discount the “inflation” collapse and the negative economic news to come. Evidence is the pullback in the 2-year T-Note yield from its high in early-November to below its 50-week MA (the blue line on the following chart). This is the first sustained break below the 50-week MA since the upward trend was established in 2021. A break below the 90-week MA (the black line on the chart) would be a definitive signal that the 2-year yield’s cyclical trend has changed from up to down.

Based on the leads and lags of the past three decades, if the early-November high for the 2-year yield proves to be the ultimate high for the cycle, which it very likely will, then the Fed has made its last rate hike and will be cutting rates by the final quarter of next year. Our guess is that the Fed’s first rate-cut will occur during the second or third quarter of 2023.

Print This Post Print This Post

When will rising interest rates become a major problem for the stock market?

We asked and answered the above trick question in a blog post on 22nd March. It’s a trick question because although rising interest rates put downward pressure on some stock market sectors during some periods, they are never the primary cause of major, broad-based stock market declines. After all, the secular equity bull market that began in the early-to-mid 1940s and ended in the mid-to-late 1960s unfolded in parallel with a rising interest-rate trend, and the preceding secular equity bear market unfolded in parallel with a declining interest-rate trend.

As explained in the above-linked post from March-2021, when assessing the prospects of the stock market we should be more concerned about monetary conditions than interest rates. The reason, in a nutshell, is that it isn’t always the case that rising interest rates indicate tightening monetary conditions or that falling interest rates indicate loosening monetary conditions. For example, there was a substantial tightening of monetary conditions in parallel with falling interest rates during 2007-2008.

When attempting to determine the extent to which monetary conditions are tight or loose, one of the most important indicators is the growth rate of the money supply itself.

Rapidly inflating the money supply leads to a period of unsustainable economic vigour called a boom, while a subsequent slowing of the monetary inflation rate leads to a transition from boom to bust. Furthermore, once a boom has been set in motion a subsequent unravelling that eliminates all or most of the superficial progress becomes inevitable. The unravelling can be delayed by maintaining a fast pace of money-supply growth, but doing so will have the effect of making the eventual bust more severe.

Over the past 25 years, booms have begun to unravel within 12 months of the year-over-year growth rate of G2 (US plus eurozone) True Money Supply (TMS) dropping below 6%. In the typical sequence there is a decline in the G2 monetary inflation rate to below 6%, followed within 12 months by the start of an economic bust (the unravelling of the monetary-inflation-fuelled boom), followed within 12 months by an official recession. Usually, the broad stock market begins to struggle from the time the boom starts to unravel, that is, from the time the G2 monetary inflation rate drops below 6%.

In the above-linked post from March-2021, we concluded:

…it’s likely that the unravelling of the current boom will begin with the monetary inflation rate at a higher level than in the past. However, with the G2 TMS growth rate well into all-time high territory and still trending upward it is too soon (to put it mildly) to start preparing for an equity bear market.

It is still too soon to start preparing for an equity bear market (as opposed to a significant correction, which may well be on the cards), but the following chart of the G2 TMS growth rate shows that there has been a dramatic change over the past few months. Based on what has happened and what probably will happen on the monetary front, the conditions could be ripe for the next boom-to-bust transition to begin during the first half of next year.

G2TMS_060721

Print This Post Print This Post

When will rising interest rates become a major problem for the stock market?

[This blog post is an excerpt from a recent TSI commentary]

The title of this discussion is a trick question. The reason is that while rising interest rates put downward pressure on some stock market sectors during some periods, it is not clear that rising interest rates bring about major, broad-based stock market declines. After all, the secular equity bull market that began in the early-to-mid 1940s and ended in the mid-to-late 1960s unfolded in parallel with a rising interest-rate trend.

The conventional wisdom that rising interest rates eventually become a major problem for the stock market exists for two inter-related reasons. First, there is a strong tendency for major equity market declines to be preceded by a sustained and substantial tightening of monetary conditions. Second, it is common for a substantial tightening of monetary conditions to be accompanied by rising interest rates.

However, a sustained and substantial tightening of monetary conditions would bring about major weakness in the stock market even if interest rates were low or falling. This, in essence, is what happened during 2007-2008. The corollary is that a rising interest-rate trend would never become a major problem for the overall stock market as long as monetary conditions remained sufficiently accommodative.

The point is that when assessing the prospects of the stock market we should be more concerned about monetary conditions than interest rates, because it isn’t a given that rising interest rates indicate tightening monetary conditions or that falling interest rates indicate loosening monetary conditions. How, then, do we know the extent to which monetary conditions are tight or loose?

One of the most important indicators, albeit not the only useful indicator, is the growth rate of the money supply itself.

Good economic theory informs us that rapidly inflating the money supply leads to a period of unsustainable economic vigour called a boom, and that the boom begins to unravel after the monetary inflation rate slows. Over the past 25 years, booms have begun to unravel within 12 months of the year-over-year growth rate of G2 (US plus eurozone) money supply dropping below 6%.

The following chart shows the year-over-year growth rate of G2 True Money Supply (TMS), with a horizontal red line drawn to mark the 6% growth level mentioned above and vertical red lines drawn to mark the official starting times of US recessions. In the typical sequence, there is a decline in the G2 monetary inflation rate below 6%, followed within 12 months by the start of an economic bust (the unravelling of the monetary-inflation-fuelled boom), followed within 12 months by an official recession.

The time from a decline in the G2 monetary inflation rate to below 6% to the start of a recession can be two years or even longer, but the broad stock market tends to struggle from the time that the boom begins to unravel. This typically occurs within 12 months of the monetary inflation rate dropping below 6%, regardless of what’s happening with interest rates.

Now, it’s likely that the unravelling of the current boom will begin with the monetary inflation rate at a higher level than in the past. However, with the G2 TMS growth rate well into all-time high territory and still trending upward it is too soon (to put it mildly) to start preparing for an equity bear market.

Print This Post Print This Post

Lower interest rates lead to slower growth

[This blog post is a modified excerpt from a TSI commentary]

In one important respect, the average central banker is like the average politician. They both tend to focus on the direct and/or short-term effects and ignore the indirect and/or long-term effects of policies. In the case of the politician, this is understandable if not excusable. After all, the overriding concern of the average politician is winning the next election. The desire to be popular also influences the decisions of central bankers, but there is a deeper reason for the members of this group’s shortsightedness. The deeper reason is their unwavering commitment to Keynesian economic theory.

All central bankers are Keynesians at heart (if they weren’t they wouldn’t be central bankers), and Keynesian economic theory revolves around the short-term and the superficial. It’s all about policy-makers in the government and the central bank attempting to ‘manage’ the economy by stimulating demand under some conditions and dampening demand under other conditions, with the conditions determined by measures of current or past economic activity. For example, if certain statistics move an arbitrary distance in one direction then an attempt will be made to boost “aggregate demand”. That the concept of “aggregate demand” is bogus is never acknowledged, because acknowledging that the economy comprises millions of distinct individuals as opposed to an amorphous blob would call into question the entire basis for central control of money and interest rates.

In the short-term, the manipulation of money and interest rates often seems to work. In particular, pumping money and forcing interest rates below where they otherwise would be can lead to increased economic activity in the form of more consumption and more investment. What’s happening, however, is that false signals are causing people to make mistakes.

One problem is that people are incentivised by cheaper credit to consume more than they can afford, which guarantees reduced consumption in the future. The bigger problem, though, is on the investment front, in that projects and businesses that would not be financeable at free-market rates of interest are made to appear economically viable. This could seem like a very good thing for a while, but it means that a lot of resources get used in ventures that eventually will fail. It also means that the businesses that would have been viable in a non-manipulated rate environment suffer profit-margin compression due to the ability, created by the abundance of artificially-cheap credit, of relatively inefficient and/or unprofitable competitors to remain in operation.

In addition to the above, the persistent downward manipulation of interest rates leads to huge pension-fund deficits. However, burgeoning shortfalls in the world of pension funds is a major economic and political issue that deserves separate treatment and is outside the scope of this short discussion. Suffice to say right now that the massive unfunded pension liabilities that have arisen due to the policy of interest-rate suppression could be the excuse for new policies that are even more destructive, such as policies based on Modern Monetary Theory (MMT).

Summing up, the policy of interest-rate suppression promotes resource wastage and general profit-margin compression. It therefore reduces economic growth over the long term. Furthermore, it’s not so much that central bankers weigh the long-term cons against the short-term pros and opt for the latter; it’s that their chosen theoretical framework doesn’t even allow them to consider the long-term cons. That’s how the head of the ECB is able to argue with a straight face that even though euro-zone interest rates have been manipulated well into negative territory, more interest-rate suppression is needed to support the economy.

Print This Post Print This Post

Interest rates and the stock market

There is no simple relationship between interest rates and the stock market. In particular, a lower interest rate doesn’t necessarily lead to a higher stock market and a higher interest rate doesn’t necessarily lead to a lower stock market.

The conventional wisdom on this topic is based largely on what happened over the past few decades. Clearly, US equities generally fared well after interest rates embarked on a long-term downward trend in the early 1980s and generally fared poorly when interest rates were in a rising trend during the 10-14 year period prior to the early 1980s. Also, the inverse relationship (a lower interest rate leads to a higher stock market and a higher interest rate leads to a lower stock market) seemed to make sense and was incorporated into a popular stock market valuation tool called “The Fed Model”.

The Fed Model compares the earnings yield of the S&P500 Index (the reciprocal of the S&P500′s P/E ratio, expressed as a percentage) with the 10-year T-Note yield to determine if the stock market is over-valued or under-valued. The higher the S&P500 yield relative to the 10-year T-Note yield, the better the value supposedly offered by the stock market. An implication is that if the 10-year yield is very low, the S&P500 can have a very high P/E ratio and still not be over-valued. For example, according to the Fed Model the S&P500 is attractively valued today. This is because even though the current P/E ratio is almost as high as it ever gets (excluding the 1999-2000 bubble period), the current earnings yield is well above the current 10-year T-Note yield.

However, the simple relationship between interest rates and the stock market only makes sense at a superficial level. It doesn’t hold up under deeper analysis. The reason is that the current value of a company is the sum of all of that company’s future cash flows discounted at some rate, and in most cases it will not be appropriate to use today’s interest rate to discount cash flows that won’t happen until many years or even decades into the future.

When picking a rate at which to discount distant cash flows it would be more reasonable to use a long-term average interest rate than to use the current interest rate. Furthermore, there is no good reason why the change in the interest rate over the next 12 months should significantly affect the interest rate used to discount cash flows that are expected to occur 10-20 years into the future.

But if it is wrong to assume that the stock market should trend inversely to the interest rate over long periods, then why did this assumption prove to be correct over the bulk of the past 50 years?

The first part of the answer is that over the very long term the stock market swings from under-valued to over-valued and back again and that in the early 1980s a bond market under-valuation extreme happened to coincide with a stock market under-valuation extreme. The second part of the answer is that financial market history goes back much further than 50 years and the simple relationship on which the Fed Model is based is not apparent prior to 1970. In essence, the theory that a lower interest rate leads to a higher stock market and a higher interest rate leads to a lower stock market is an artifact of the past 50 years.

The above statement is supported by the following charts. The charts show the Dow Industrials Index and the 10-year T-Note yield from the beginning of 1925 through to the end of 1968.

The US stock market (as represented by the Dow Industrials in this case) was in a secular bearish trend from 1929 until 1942. Apart from an upward spike due to fear of government default in 1931, the 10-year yield was in a downward trend during this bearish stock market period. The stock market then embarked on a secular bullish trend that didn’t end until the late-1960s. The 10-year yield was in an upward trend during this bullish stock market period. That is, the long-term relationship between interest rates and the stock market during 1929-1968 was the opposite of what it was over the past 50 years.

DJIA_10YTNote_170719

Print This Post Print This Post

Revisiting the age-old relationship between interest rates and prices

There is an age-old relationship between prices and interest rates that Keynesian economists have called a paradox (“Gibson’s Paradox”). The relationship was clearer during the Gold Standard era, but as I explained in a previous post it is still apparent if prices are measured in gold.

To understand “Gibson’s Paradox” and why it actually isn’t a paradox, refer to the earlier post linked above. Suffice to say that when money is sound or at least a lot sounder than it is today, interest rates don’t drive prices and prices don’t drive interest rates; instead, on an economy-wide basis both prices (in general) and risk-free interest rates are driven by changes in societal time preference. Moreover, as mentioned above and explained in my earlier post, even with today’s massive, continuous manipulation of interest rates by central banks the relationship is still evident, but only when interest rates are compared to a wholesale price index denominated in gold.

The commodity/gold ratio is the price of a broad-based basket of commodities in gold terms. In essence, it is a wholesale price index using gold as the monetary measuring stick. Also, the risk-free US interest rate that is least affected by the direct manipulation of the Fed is the yield on the 30-year T-Bond, so if the age-old relationship still works then what we should see is a positive correlation between the commodity/gold ratio and the T-Bond yield. Or, looking at it from a different angle, what we should see is a positive correlation between the gold/commodity ratio and the T-Bond price. That’s exactly what we do see.

Using the Goldman Sachs Spot Commodity Index (GNX) to represent commodities, the following chart shows that the age-old relationship has worked over the past 12 years when gold is the monetary measuring stick.

gold_USB_LT_221018

The next chart zooms in on the most recent 2 years and shows that over the past three weeks there has been a significant divergence, with the gold/commodity ratio turning upward and the T-Bond price staying on a downward path. It’s a good bet that this divergence will be eliminated within the next two months via either a decline in the gold/commodity ratio to a new multi-year low or a rebound in the T-Bond. My money is on the latter.

gold_USB_221018

Print This Post Print This Post

Interest Rates and Gremlins

Everyone is familiar with the term “interest rate”, but most people don’t understand what the term means. Unless you understand what the term means, you won’t fully understand why the central bank’s ‘management’ of interest rates damages the economy.

To understand what the interest rate is, it helps to understand what it isn’t. It isn’t the price of money. The price of money is what money buys, which can be different in every transaction. For example, if an apple is priced at $1, a new car is priced at $30,000 and a dental checkup is priced at $100, then the price of a dollar can be said to be 1 apple or 1/30000th of a car or 1/100th of a dental checkup.

The interest rate is the price paid by a borrower for a temporary increase in his purchasing power, or, looking at it from a different angle, the price received by a lender in consideration for temporarily giving up some of his purchasing power. This price will naturally take into account the risk that the borrower will be unable to make full repayment (credit risk) and the risk that money will be worth less in the future than it is at the time the loan is made (inflation risk). However, even if there were no credit or inflation risk to consider the interest rate would still be positive. The reason is that a unit of money in the hand today will always be worth more than a promise to pay a unit of the same money in the future.

This means that as well as being determined by the risk of default and the risk of inflation, the interest rate in any transaction will be determined by the time preferences of the borrower and lender. Someone with a strong desire to consume in the present has a high time preference. It’s likely that if this person has insufficient money to satisfy his immediate desire to consume then he will be willing to pay a high rate of interest to temporarily increase his purchasing power. Alternatively, it’s likely that someone whose desire to consume in the present is low relative to the amount of cash he has on hand will be willing to lend money to the right borrower at a relatively low rate of interest.

In any given transaction the credit risk component of the overall interest rate will end up being part of the lender’s real return if the borrower doesn’t default, but if credit risk is priced correctly then over a large number of transactions the amount received to compensate for this risk will be offset by actual borrower default. For example, if the risk of borrower default is correctly priced at 5%/year, then over a large number of transactions enough borrowers will default to impose a cost on the lender of 5%/year. Therefore, the time component of the interest rate is the same as the expected real return to the lender.

The implication is that on an economy-wide basis the real interest rate should be determined by the average of people’s time preferences.

To further explain, when the quantity of real savings is high relative to the general desire to consume in the present, the average time preference is low and the real interest rate SHOULD be low. Entrepreneurs and other businessmen will respond to this interest-rate signal by embarking on long-term projects that assume a future increase in consumer spending (high savings in the present implies higher consumer spending in the future). Capital equipment will be purchased, office buildings and shopping malls will be built, etc. When the quantity of real savings is low and people throughout the economy are consuming with abandon, the average time preference is high and the real interest rate SHOULD be high. Entrepreneurs and other businessmen will respond to this interest-rate signal by holding-off on new long-term projects. Although they won’t look at it in these terms, in effect they are being told, by the way the market is pricing time, that the future level of consumer spending will be insufficient to support certain investments.

The word “should” is capitalised in the previous paragraph because in the real world there exists a gremlin with the power to distort the interest rate. The gremlin is constantly tinkering with the interest rate, the result being that this vital price signal is always misleading to some degree. In fact, thanks to the mischievous acts of this gremlin the interest-rate signal is occasionally the opposite of what it should be.

Of particular relevance, due to the gremlin’s preference for distorting the interest rate in a downward direction the real interest rate is sometimes low during periods when the quantity of savings is low and the majority of people are spending like crazy, that is, when the average time preference is high. The result is that entrepreneurs and other businessmen throughout the economy embark on long-term projects that have no hope of being profitable. Individuals will naturally make mistakes, but for a large proportion of the population to make the same investing error the interest-rate signal must be wrong.

No prize for guessing the identity of the gremlin.

Print This Post Print This Post

Are rising nominal interest rates bullish or bearish for gold?

The short answer to the above question is that they are neither. Read on for the longer answer.

Consider what happened to nominal interest rates during the long-term gold bull markets of the past 100 years. Interest rates generally trended downward during the gold bull market of the 1930s, upward during the gold bull market of the 1960s and 1970s, and downward during the bull market of 2001-2011. History’s message, therefore, is that the trend in the nominal interest rate does not strongly influence gold’s long-term price trend.

History tells us that gold bull markets can unfold in parallel with rising or falling nominal interest rates, but this shouldn’t be interpreted as meaning that interest rates don’t affect whether gold is in a bullish or bearish trend. The long-term trend in the nominal interest rate is not critical; what is of great importance, as far as the gold market is concerned, is the REAL interest rate, with low/falling real interest rates being bullish for gold and high/rising real interest rates being bearish. For example, when gold was making huge gains during the 1970s in parallel with high/rising nominal interest rates, real interest rates were generally low. This is because gains in inflation expectations were matching, or exceeding, gains in nominal interest rates (the real interest rate is the nominal interest rate minus the EXPECTED rate of currency depreciation).

Very low real interest rates are artifacts of central banks, because in an intervention-free market all lenders would insist on a significant real return in exchange for temporarily relinquishing control of their money. In other words, “very low real interest rates” essentially means “very loose monetary policy”.

Something else that affects gold’s price trend is the difference between long-term and short-term interest rates (the yield-spread, or yield curve), with a rising yield-spread (‘steepening’ yield curve) being bullish for gold and a falling yield-spread (flattening yield curve) being bearish. It works this way because a rising trend in long-term interest rates relative to short-term interest rates generally indicates either falling market liquidity (associated with increasing risk aversion and a flight to safety) or rising inflation expectations, both of which are bullish for gold.

As is the case with the real interest rate, under the current monetary system the yield-spread tends to be a symptom of what central banks are doing. If money were free of central bank manipulation then the yield-spread would spend most of its time near zero (the yield curve would be almost horizontal) and would experience only minor fluctuations, but thanks to the attempts by central banks to ‘stabilise’ the financial world the yield-spread experiences the huge swings shown on the chart included below.

yieldcurve_270417

Last but not least, gold is influenced by the economy-wide trend in credit spreads (the differences between interest rates on high-quality and low-quality debt securities). Gold, a traditional haven in times of trouble, tends to do relatively well when credit spreads are widening and relatively poorly when credit spreads are contracting.

In summary, gold benefits from low real interest rates, an increasing yield-spread (a steepening yield curve), and widening credit spreads, each of which can occur when nominal interest rates are rising or falling.

Print This Post Print This Post

An age-old relationship between interest rates and prices

The chart displayed near the end of this discussion is effectively a pictorial representation of what Keynesian economists call a paradox* (“Gibson’s Paradox”) and Austrian economists call a natural and perfectly understandable relationship.

Gibson’s Paradox was the name given by JM Keynes to the observation that interest rates during the gold standard were highly correlated to wholesale prices but had little correlation to the rate of “inflation”, that is, that interest rate movements were connected to the level of prices and not the rate of change in prices. It was viewed as a paradox because most economists couldn’t explain it. According to conventional wisdom, interest rates should have been positively correlated with the rate of “price inflation”.

The problem is that most economists did not — and still do not — understand what interest rates are.

First and foremost, interest rates are the price of time. They reflect the fact that, all else being equal, humans place a higher value on getting something now than on getting exactly the same thing at some future time. Interest rates transcend money, because they exist even when money does not. With or without money and all else being equal, getting something now will always be worth more than getting the same thing in the future**. This is called time preference.

Time preference is the root of interest rates and the natural interest rate is a measure of societal time preference. That is, the natural interest rate is a measure of the general urgency to consume in the present or the amount that would have to be paid, on average, to make saving (the postponement of consumption) worthwhile. For example, the average 7-year-old child has a very high time preference, in that if you give the kid a choice between getting a desirable toy today or getting something more in 3 months’ time, the “something more” option won’t be chosen unless it is a LOT more, whereas a middle-aged adult with substantial savings is likely to have low time preference.

When interest rates are properly understood it becomes clear that the paradox named after Gibson is no paradox at all. The reason is that if the money is sound, as it mostly was under the Gold Standard, both interest rates and prices will move in the same direction in response to changes in societal time preference.

To further explain, during a period of rising time preference, that is, during a period when there is an increasing desire to consume in the present, the prices of goods will rise (on average) due to increasing demand and it will take a higher interest rate to encourage people to delay their spending. During a period of falling time preference, that is, during a period when there is an increasing desire to save, the prices of goods will fall (on average) and people will generally accept a lesser incentive (interest rate) to delay their spending.

In a nutshell, there is no paradox because, when the money is sound, interest rates don’t drive prices and prices don’t drive interest rates; instead, on an economy-wide basis*** both prices and interest rates are driven by changes in societal time preference.

That’s all well and good, but we no longer have sound money. Moreover, we have massive, continuous manipulation of interest rates by central banks. The signal that interest rates should send is therefore now being overwhelmed by central-bank-generated noise to the point where it’s a miracle (a testament to the resilience of entrepreneurial spirit, actually) that we still have a functioning economy. Quite remarkably, though, signs of the age-old relationship between interest rates and the price level can still be found if you know where to look.

The signs aren’t apparent when interest rates are compared with an official wholesale price index, because a great effort is expended by the central planners to ensure that the official money loses purchasing power year-in and year-out regardless of what’s happening in the world. However, the signs are apparent when interest rates are compared to a wholesale price index based on gold.

The commodity/gold ratio is the price of a broad-based basket of commodities in gold terms. In essence, it is a wholesale price index using gold as the monetary measuring stick. Although gold is no longer money in the true meaning of the term (it is no longer the general medium of exchange), it is still primarily held for what can broadly be called ‘monetary purposes’ and in many respects it trades as if it were still money. According to the age-old relationship discussed above and labeled “Gibson’s Paradox” by a confused JM Keynes, the commodity/gold ratio should generally move in the same direction as risk-free interest rates.

The risk-free US interest rate that is least affected by the direct manipulation of the Fed is the yield on the 30-year T-Bond, so what we should see is a positive correlation between the commodity/gold ratio and the T-Bond yield. Or, looking at it from a different angle, what we should see is a positive correlation between the gold/commodity ratio and the T-Bond price. That’s exactly what we do see.

Using the Goldman Sachs Spot Commodity Index (GNX) to represent commodities, the following chart shows that the age-old relationship has worked over the past 10 years when gold is the monetary measuring stick. It has also worked over the past 20 years, although there was a big divergence — possibly due to the ‘China effect’ on commodity prices or the ECB’s aggressive money pumping — in 2005.

I like this chart because it makes economic sense and because it can be helpful when trying to anticipate the next important turning point for the gold/commodity ratio and/or the T-Bond.

GCvsUSB_140217

*As a general rule, if your theory leads to a paradox then your theory is wrong.

    **There are many real-life examples of a premium being paid to receive a good in the future rather than the present, but in such cases all is not equal. That is, in such cases there will be a difference between the future good and the present good that makes the future good more valuable. For example, an oil refiner will generally pay more for a barrel of oil to be delivered in six months’ time than a barrel of oil to be delivered immediately, because if it doesn’t plan to refine the oil until 6 months from now it can save 6 months of storage costs by purchasing oil for future delivery. To put it another way, in this oil-refiner example a barrel of oil for immediate delivery is priced at a discount because it comes with 6 months of storage-related baggage.

    ***For any specific interest-rate-related transaction, credit risk will be very important. As a result, at any given time there will be a wide range of interest rates within an economy even if the money has no “inflation” risk. However, it is reasonable to think of time preference as an interest-rate floor that rises and falls. In effect, time preference determines the interest rate that would apply on average throughout the economy if there were no credit or inflation risks.

Print This Post Print This Post

Interest rates are NOT the price of money

Rarely does a month go by when I don’t read at least one article in which interest rates are said to be the price of money. This is wrong. The price of money is what money can buy. The rate of interest is something completely different.

If an apple sells for 1 dollar then the price of a unit of money in this example is 1 apple. If a car sells for 30,000 dollars then the price of a unit of money in this example is 1/30,000th of a car. In more general terms, just as the price of any good, service or asset can be quoted in terms of money, the price of money can be quoted in terms of the goods, services and assets that it buys. In a large economy, at any given time a unit of money will have millions of different prices.

As an aside, this is why price indices that purport to represent the purchasing power of money will always be bogus. Regardless of how rigorous and well-intentioned the effort, it is not possible to come up with a single number that properly indicates the “general price level”. There is simply no such thing as the general price level.

What, then, is the interest rate?

The interest rate is the cost incurred or the payment received for exchanging a present good for a future good. If there is no risk of loss involved in the transaction then the interest rate will reflect nothing other than the time preferences of the person who parts with the present good (usually called the lender) and the person who receives the present good (usually called the borrower). In other words, if there is no risk of loss then the interest rate can correctly be thought of as the price of time.

In most cases there will, of course, be a risk of loss due to the possibility that the borrower will default or the possibility — if it was money that was exchanged — that the loan will be repaid in terms of money that doesn’t buy as much as it did when the initial exchange took place. In most cases the interest rate will therefore be the price of time plus a premium to account for default risk and “inflation” risk.

Time preference sets a lower limit on market interest rates and time preference will always be positive. The negative interest rates set in place by some central banks therefore have nothing to do with market forces and everything to do with heavy-handed manipulation by people who have far more power than sense.

Print This Post Print This Post

Are rising interest rates bullish or bearish for gold?

I’ve seen articles explaining that rising interest rates are bearish for gold and I’ve seen articles explaining that rising interest rates are bullish for gold, so which is it? Are rising interest rates bullish or bearish for gold? The short answer is no — rising interest rates are neither bullish nor bearish for gold. Read on for the much longer answer.

I’ll begin by noting what happened to nominal interest rates during the long-term gold bull markets of the past 100 years. Interest rates generally trended downward during the gold bull market of the 1930s, upward during the gold bull market of the 1960s and 1970s, and downward during the gold bull market of 2001-2011. Therefore, history’s message is that the trend in the nominal interest rate does not determine gold’s long-term price trend.

History tells us that gold bull markets can unfold in parallel with rising or falling nominal interest rates, but this shouldn’t be interpreted as meaning that interest rates don’t affect whether gold is in a bullish or bearish trend. The nominal interest rate is not important, but the REAL interest rate definitely is. Specifically, low/falling real interest rates are bullish for gold and high/rising real interest rates are bearish. For example, when gold was making huge gains during the 1970s in parallel with high/rising nominal interest rates, real interest rates were generally low. This is because gains in inflation expectations were matching, or exceeding, gains in nominal interest rates (the real interest rate is the nominal interest rate minus the EXPECTED rate of currency depreciation). Also, the 2001-2011 bull market occurred in parallel with generally low real interest rates.

Very low real interest rates are artifacts of central banks. In the US, for example, the Fed’s actions ensured that the real short-term interest rate on “risk free” (meaning: no direct default risk) debt spent a lot of time in negative territory during the 1970s and during 2001-2011. In effect, “very low real interest rates” means “excessively loose monetary policy”.

Something else that affects gold’s price trend is the DIFFERENCE between long-term and short-term interest rates (the yield-spread, or yield curve), with a rising yield-spread (steepening yield curve) being bullish for gold and a falling yield-spread (flattening yield curve) being bearish. It works this way because a rising trend in long-term interest rates relative to short-term interest rates generally indicates either falling market liquidity (associated with increasing risk aversion and a flight to safety) or rising inflation expectations, both of which are bullish for gold.

As is the case with the real interest rate, under the current monetary system the yield-spread tends to be a symptom of what central banks are doing. If money were sound and free of central bank manipulation, then the yield-spread would spend most of its time near zero (the yield curve would be almost horizontal) and would experience only minor fluctuations, but thanks to the attempts by central banks to ‘stabilise’ the markets the yield-spread experiences huge swings. For example, the following chart shows the huge swings in the US 10yr-2yr yield-spread since 1990. The periodic up-swings in this chart were generally due to the Fed exerting irresistible downward pressure at the short end of the curve while the discounting by the market of currency depreciation risk caused interest rates at the long end to be ‘sticky’.

yieldspread_040116

Last but not least, gold is influenced by the economy-wide trend in credit spreads (the differences between interest rates on high-quality and low-quality debt securities). Gold, a traditional haven in times of trouble, tends to do relatively well when credit spreads are widening and relatively poorly when credit spreads are contracting. This is because widening credit spreads typically indicate declining economic confidence.

If the three main interest-rate drivers (the real interest rate, the yield-spread and credit spreads) are gold-bullish then there’s a high probability that gold will be in a strong upward trend in terms of all currencies and most commodities. By the same token, if the three main interest-rate drivers are gold-bearish then there’s a high probability that gold will be in a strong downward trend in both nominal and real terms. However, it’s not uncommon for the interest-rate conditions to be mixed. The past year is a good example of a mixed interest-rate backdrop for gold in that during this period the credit-spread situation was generally gold-bullish (credit spreads were widening) while the real interest rate and yield-spread trends were generally gold-bearish. The net effect of this interest-rate backdrop was slightly bearish for gold.

In summary, gold benefits from low/falling real interest rates, an increasing yield-spread (a steepening yield curve), and widening credit spreads, each of which can occur when nominal interest rates are rising or falling. You can therefore ignore the “rising interest rates are bearish for gold” and the “rising interest rates are bullish for gold” arguments. The relationship between gold and interest rates is not that simple.

Print This Post Print This Post

Negative interest rates are due to bad theory

If something very strange happens and continues over an extended period, people get accustomed to it and come to view it as normal. That’s especially so when the strange set of circumstances is the result of a policy that, as a result of devotion to a wrong theory or strategy, is widely considered to be a reasonable response to a problem.

A good example is the “Patriot Act”, which was introduced in the wake of the 911 attacks. This act dramatically increased the legal ability of the US government to violate individual property rights in the name of greater security and was widely viewed as extraordinary when it was first proposed, but in 2011 there was barely a mention in the mainstream media when President Obama signed a 4-year extension for some of the most controversial parts of the act. With some modifications forced upon the government by the revelations of Edward Snowden, another 4-year extension was approved with minimal public protest in 2015 under the Orwellian name “USA Freedom Act”. My point is, whereas 20 years ago most people would have been horrified by the provisions of the Patriot Act, today most people couldn’t care less. Today, the powers granted by the Patriot Act are generally accepted as normal.

Another good example is the downward drift into negative territory of government bond yields in Europe. As recently as two years ago it was believed by almost everyone that zero was the lower bound for a bond’s nominal yield. At that time, the idea that nominal bond yields would fall to zero was almost unthinkable, and anyone who predicted that a sizable percentage of the bonds issued by European governments would soon trade at negative nominal yields would have been perceived as a lunatic. Today, however, about one-third of the euro-zone’s sovereign debt is trading with a negative yield-to-maturity and people are becoming accustomed to this new reality. Also, the ECB just reduced its official deposit rate from negative 0.20% to negative 0.30%, which only surprised the financial markets because most traders were expecting it to be pushed even further into negative territory.

A point that deserves to be emphasised is that even though the financial world is becoming inured to the situation, it is completely absurd for interest rates and nominal bond yields to be negative. The reason is that regardless of whether the economy is experiencing inflation or deflation, having money in the present should always be worth more than having a promise to pay the same quantity of money in the future. To put it another way, it should never make sense for people throughout the economy to choose to incur a cost for temporarily relinquishing ownership of money.

But obviously it does make sense, because it’s happening! The question is why.

A number of factors had to come together to make negative interest rates possible, including persistently-low inflation expectations in the face of rapid monetary inflation. However, the overarching cause is unswerving devotion to bad economic theory. Persistently-low inflation expectations only enabled the application of bad theory to be taken to a far greater extreme than it had ever been taken before.

The bad theory is that the economy can be made stronger by artificially lowering the rate of interest. If you have the power to manipulate interest rates and you are totally committed to this theory, then a failure of the economy to strengthen following a lowering of the interest rate will cause you to bring about a further interest-rate decline. As long as you remain steadfast in your belief that a lower interest rate should help and as long as rising inflation expectations don’t get in the way, continuing economic weakness will lead you further and further down the interest-rate suppression path.

The Fed currently looks less radical than the ECB, because, while the ECB has pushed its targeted interest rate into negative territory and shows no sign of changing course, the Fed is probably about to take a small step into positive territory with its own targeted interest rate. However, the senior members of the Fed and the ECB are guided by the same bad theories, so it is certainly possible that the next time the US economy slides into recession the US will end up with a negative Fed Funds Rate. In fact, if the US economy slides into recession in 2016 then a negative Fed Funds Rate will become a good bet.

In conclusion, today’s negative interest rate situation would have been viewed as nonsensical as recently as a few years ago and will be viewed as nonsensical by the historians who write about the 2010s in decades to come. However, the financial world is not only becoming accustomed to this absurd situation, it is now common to view negative interest rates as appropriate.

Print This Post Print This Post

New tools for manipulating interest rates

At TSI over the past year and at the TSI Blog two months ago I’ve made the point that the Fed gave itself the ability to pay interest on bank reserves so that the Fed Funds Rate (FFR) could be raised without the need to shrink bank reserves and the economy-wide money supply. I explained that the driver of this change in the Fed’s toolbox was the fact that the massive quantity of reserves injected into the banking system by QE (Quantitative Easing) meant that it would no longer be possible for the Fed to hike the FFR in the traditional way, that is, via the sort of small-scale shrinkage of bank reserves that was used in the past. Instead, the quantity of reserves has become so much larger than would be required to maintain a Funds Rate of only 0.25% that even a tiny increase to 0.50% would necessitate a $1 trillion+ reduction in reserves and money supply, which would crash the stock and bond markets. The purpose of this post is to point out that while the payment of interest on bank reserves is now the Fed’s primary tool for implementing rate hikes, there are two other tools that the Fed will use over the years ahead in its efforts to manipulate short-term US interest rates and distort the economy.

Before going any further I’ll note that it isn’t just logical deduction that led to my conclusion regarding the purpose of interest-rate payments on bank reserves. It happens to be the only conclusion that makes sense, but it’s also the case that the Fed, itself, has never made a secret of why it started paying interest on reserves. The Fed’s reasoning was reiterated in a 27th February speech by Vice Chairman Stanley Fischer. A hat-tip to John Mauldin and Woody Brock for bringing this speech to my attention.

The two other tools that will be used by the Fed to raise the official overnight interest rate are Reverse Repurchase agreements (RRPs) and the Term Deposit Facility (TDF). The RRP isn’t a new tool, but its importance has increased and will continue to do so. The TDF is a relatively new tool, having been introduced on a small scale in 2010 and having been expanded in 2014.

The RRP is used by the Fed to borrow reserves and money for short periods, with securities (bonds, notes or bills) from the Fed’s stash being used as collateral for these borrowings. Now, an institution that has the unlimited ability to create new money can never run short of money and will therefore never need to borrow money to fund its operations, but the Fed sometimes borrows money via RRPs as part of its efforts to manipulate interest rates. Specifically, by offering to pay financial institutions a certain interest rate to borrow reserves and money, the Fed pressures the effective interest rate towards its target.

The TDF is similar to a normal money-market account, except that it is provided by the Fed and can only be used by depository institutions. The term of the deposit is currently up to 21 days and the interest rate paid is slightly above the rate paid on bank reserves.

Further to the above, when the Fed eventually decides to hike the Fed Funds Rate it will not do so by reducing the quantity of bank reserves. The quantity of bank reserves will probably decline as part of the rate-hiking process, but the quantity of reserves in the banking system is now so far above what it needs to be that it is no longer practical for reserve reduction to be the driver of a higher Fed Funds Rate. Instead, when the Fed makes its first rate hike — something that probably won’t happen until at least September-2015 — it will do so by 1) raising the interest rate paid on bank reserves, 2) increasing the amount that it pays to borrow money via Reverse Repurchase agreements, and 3) boosting the rate that it offers to financial institutions for term deposits.

Print This Post Print This Post

Gold and the ‘Real’ Interest Rate

[This blog post is an excerpt from a commentary published at TSI last week]

One of the few commonly-believed things about gold that is actually true is that gold tends to become more valuable when the real interest rate is trending downward and less valuable when the real interest rate is trending upward. Furthermore, although the real interest rate trend is just one of seven inputs to our Gold True Fundamentals Model (GTFM) and usually doesn’t have a greater effect than the other inputs, over the past three months it clearly has been the dominant fundamental influence on the US$ gold price. This prompted us to ask: Have there been times in the past when the change in the real interest rate trumped all other considerations?

Before we answer the above question we’ll reiterate a point we’ve made numerous times in the past, which is that the only way to get an accurate read on the real US interest rate trend is via the yields on Treasury Inflation Protected Securities (TIPS). Unfortunately, the TIPS market did not exist prior to 2003, so there is no way of measuring the performance of real interest rates during earlier periods. In particular, it would be extremely useful to know the performance of real interest rates during the 1970s (the last time that “inflation” was widely viewed as “Public Enemy No. 1”), but the information simply isn’t available. It is tempting to calculate the real interest rate that prevailed in earlier periods by using what is available, for example, by subtracting the year-over-year change in the CPI from the nominal interest rate. However, you can’t make up for the lack of a legitimate number by using a bogus one.

As far as we can tell, during the 19.5 years since the TIPS market came into being there has been only one other multi-month period when the real interest-rate trend caused a sizable move in the gold price that was counter to the overall fundamental backdrop. That period was March-October of 2008, which is the first of the three real interest rate (10-year TIPS yield) surges labelled on the following chart. During March-October of 2008 the overall fundamental backdrop was supportive for gold, but the real interest rate rise was large enough and fast enough to trump the bullish influences on the US$ gold price.

By the way, the second of the three real interest rate surges labelled on the chart occurred during April-September of 2013. This one doesn’t qualify because it occurred when economic growth expectations were rising and the overall fundamental backdrop was bearish for gold.

Like the real interest rate surge during March-October of 2008, the one that began on 8th March of this year has occurred in parallel with collapsing economic growth expectations. The difference is that whereas the 2008 surge in the TIPS yield was driven by plunging inflation expectations, the 2022 surge has been driven by rising nominal interest rates.

Despite the overall gold-bullish fundamentals, in 2008 the US$ gold price remained in a downward trend until the TIPS yield peaked. Gold then quickly retraced its decline and gold mining stocks sprang back like beachballs that had been held underwater. Based on the way things are going it is likely that something similar will happen this year.

Print This Post Print This Post

What is the ‘real’ interest rate?

The real interest rate is the nominal interest rate adjusted for the expected change in the associated currency’s purchasing power, where “expected” is the operative word. It is not the nominal interest rate adjusted for the currency’s loss of purchasing power over some prior period.

To further explain, when you buy an interest-bearing security the ‘real’ income that you receive will be determined by the future change in the currency’s purchasing power. For example, the real return from a note that matures in 12 months will be determined by the change in the currency’s purchasing power over the coming 12 months, not the change in the currency’s purchasing power over the preceding 12 months. Of course, when you buy the security you have no way of knowing what will happen to the currency’s purchasing power in the future, but your decision to buy will be based on the nominal yield offered by the security and what you EXPECT to happen to the currency. What happened to the purchasing power of the currency in the past is only relevant to the extent that it affects the expectations of investors.

Consequently, it is not appropriate to estimate the ‘real’ interest rate by subtracting a measure of historical purchasing power loss, such as the percentage change in the CPI over the last 12 months, from the current nominal yield. Doing so would result in a meaningless number even if the CPI were a valid indicator of purchasing-power loss.

A knock-on effect is that the numerous articles and reports that attempt to explain how the price of something responds to changes in the real interest rate, where the real interest rate is calculated by subtracting the change in the CPI over some prior period from the current nominal interest rate, can be put into the “not even wrong” category. They are nonsensical.

Just to be clear, the CPI and similar price indices are inherently flawed indicators of “inflation”, but even if they were good indicators of “inflation” it would make no sense to subtract the historical index change from the present-day nominal interest rate when attempting to estimate the ‘real’ return.

If the main concern is the effects of interest rates and “inflation” on the prices of assets, commodities and gold, then the numbers that matter are today’s nominal interest rates and inflation expectations. In the US these numbers are combined to generate the yields on Treasury Inflation Protected Securities (TIPS), in that the TIPS yield is the nominal yield minus the expected CPI. The TIPS yield is not an accurate indicator of the real interest rate in absolute terms, but it is an accurate indicator of the real interest-rate TREND and whether the real interest rate today is high or low relative to where it was in the past.

The following chart compares the 10-year TIPS yield with the US$ gold price. A negative correlation is apparent (the trend in the TIPS yield is often the opposite of the trend in the gold price), especially since 2007. The negative correlation doesn’t always apply, though, because the gold price is not determined solely by the real interest rate. There are several other fundamental influences, including credit spreads and the yield curve (the TIPS yield is just one of seven inputs to our Gold True Fundamentals Model).

gold_TIPS_230821

Treasury Inflation Protected Securities were first issued in 1997 and the Fed’s data used in the above chart doesn’t go back further than 2003, so the TIPS market can’t tell us what happened to real interest rates in the 1970s and 1980s. However, the non-availability of a valid number or methodology is not a good reason to use a bogus number or methodology.

Print This Post Print This Post

The rising interest-rate trend

The rising interest-rate trend in the US isn’t new and isn’t related to the Fed’s so-called “policy normalisation” program. However, it has only just started to matter.

That the rising interest-rate trend isn’t new and isn’t related to the Fed’s rate-hiking efforts is clearly illustrated by the following chart. This chart shows that the US 2-year T-Note yield began trending upward in 2011 — more than 6 years ago and more than 4 years prior to the Fed’s first rate hike.

UST2Y_050318

As we go further out in duration we find later beginnings to the rising-yield trend. This is evidenced by the following three charts, the first of which shows that the 5-year yield bottomed in mid-2012, the second of which shows that the 10-year yield double-bottomed in mid-2012 and mid-2016, and the third of which shows that the 30-year yield continued to make lower lows until mid-2016. But even in the case of the 30-year yield the rising trend is now more than 18 months old.

UST5Y_050318

UST10Y_050318

UST30Y_050318

Given that US interest rates have been rising for more than 6 years at the short end and more than 18 months at the long end, why has the trend suddenly begun to draw a lot of attention in the mainstream press?

The answer is: because rising yields on credit instruments have begun to put downward pressure on equity prices. The stock market is capable of ignoring rising interest rates for long periods, as has been demonstrated by the market action of the past few years. However, if a rising interest-rate trend persists for long enough it transforms, as far as the stock market is concerned, from an irrelevance to the most important thing.

The way that interest rates gradually turned upward over several years despite the relentless downward pressure applied by the central bank suggests that we are dealing with the end of a very long-term decline. In other words, there’s a good chance that we are now in the early stages of a 1-2 decade (or longer) rising interest-rate trend. But how could that be, when debt levels are very high and the economy-wide savings rate is very low?

Under the current monetary regime, major upward trends in interest rates are not driven by the desire to consume more in the present (the desire to save less) or by rapidly-increasing demand for borrowed money to invest in productive enterprises. That, in essence, is a big part of the problem — interest-rate trends do not reflect what they should reflect. Instead, major upward trends in interest rates are driven primarily by rising inflation expectations, or, to put it more aptly, by declining confidence in money.

Of particular relevance, under the current monetary regime it is not only possible for a large, general increase in the desire to save to be accompanied by rising interest rates, it is highly probable that when a large rise in interest rates happens it will be accompanied by a general desire to save more. It’s just that the desire for greater savings won’t manifest itself as a greater desire to hold cash. It will, instead, manifest itself as a desire to hold more of something with near-cash-like liquidity that is not subject to arbitrary devaluation by central banks and governments. Gold is the most obvious example.

Print This Post Print This Post

Why the Fed’s balance sheet reduction will be more interesting than watching paint dry

Janet Yellen has quipped that the Fed’s balance-sheet reduction program, which will start at $10B/month in October-2017 and steadily ramp up to $50B/month over the ensuing 12 months, will be as boring as watching paint dry. However, like many financial-market pundits she is underestimating the effects of the Fed’s new monetary plan.

In the old days, hiking the Fed Funds rate (FFR) involved reducing the quantity of bank reserves and the money supply, but that is no longer the case. Hiking the FFR is now achieved by raising the interest rate that the Fed pays to banks on reserves held at the Fed, which means that hiking the FFR now leads to the Fed injecting reserves into the banking system. This was explained in previous blog posts, including “Tightening without tightening (or why the Fed pays interest on bank reserves)“, “New tools for manipulating interest rates“, and “Loosening is the new tightening“.

In other words, under the new way of operating that was implemented in the wake of the Global Financial Crisis, hiking the FFR does not tighten monetary conditions. In fact, given that hikes in the FFR now result in more money being pumped INTO the banking system, an argument could be made that a hike in the FFR is now more of a monetary loosening than a monetary tightening. It is therefore not surprising that the rate hikes implemented by the Fed over the past two years had no noticeable effect on anything.

I mentioned in a blog post a few weeks ago that there has been a significant tightening of US monetary conditions since late last year, but this has not been due to the actions of the Fed. Rather, the rate of US monetary inflation has dropped substantially over the past 10 months due to a decline in the pace of commercial-bank credit expansion. As an aside, the substantial drop in the US monetary inflation rate would have affected the stock market in a bearish way by now if not for the offsetting effect of rapid euro-zone monetary inflation.

The Fed’s first genuine step along the monetary tightening path will happen within the next few weeks when it begins to shrink its balance sheet*. When this happens it will mark a momentous change in the monetary backdrop, and given that it will happen after the US monetary inflation rate has already tumbled it is likely to have financial-market consequences that are far more exciting than watching paint dry.

*The fact that the balance-sheet reduction will take place via the non-reinvestment of proceeds received from maturing securities rather than the selling of securities is neither here nor there. An X$/month balance-sheet reduction is an X$/month balance-sheet reduction, regardless of how it occurs.

Print This Post Print This Post

Comparing the rates of money-pumping

This post is a modified excerpt from a recent TSI commentary.

The following table shows the amount of monetary inflation in a number of different countries/regions. Specifically, the table shows the amount by which the money supplies of Australia, China, the Euro-Zone (EZ), Hong Kong, Japan, the UK and the US have grown over the past year, the past 2 years and the past 4 years. In those cases where it was easy for me to do the calculation I’ve used TMS (True Money Supply) as the monetary aggregate, but in other cases I’ve used M1 or M2. In China’s case I show results for both M1 and M2, because due to the lack of detail provided by the People’s Bank of China I’m not sure which of these measures is closest to TMS.

Country / Region Money Supply Aggregate 1-Year % Growth 2-Year % Growth 4-Year % Growth
Australia TMS 13.2 26.9 44.4
China M1 2.9 8.4 26.7
China M2 9.9 23.1 68.2
Euro-Zone TMS 12.2 18.4 30.6
Hong Kong M2 8.3 22.2 54.1
Japan M2 3.6 7.1 13.4
UK TMS 5.2 11.6 22.3
US TMS 7.7 16.2 47.2

Here’s some information that can be gleaned from the above table:

1) Japan continues to have a relatively slow rate of monetary inflation, despite popular opinion to the contrary. In particular, although it has now been 2 years since the BOJ began to implement the greatest QE program in world history, over the past 2 years Japan’s money supply has only increased by 7.1%. This compares to 2-year increases of 16.4% for the US, 18.2% for Europe and 26.9% for Australia. How much longer will the general perception of what’s happening in Japan diverge from the reality of what’s happening in Japan?

2) The rate of monetary inflation in the EZ is accelerating relative to the rates of monetary inflation elsewhere. That’s why the table reveals that the 12-month rate of inflation in the EZ is now second-only to that of Australia. Furthermore, if the table showed growth figures for the past 6 months it would reveal that the EZ is now leading by a wide margin in the race to inflate (a.k.a. the race to the bottom).

3) Although its M2 money supply is still growing at close to 10%/year, there has been a significant tightening of China’s monetary conditions over the past 18 months. This is — at least in part — both a cause and an effect of the deflation of the country’s property bubble. It seems that in a command economy where non-performing loans never have to be recognised as such, it is possible for a massive credit-fueled investment bubble to deflate gradually.

4) The supply of Hong Kong dollars has increased by 54% over the past 4 years. This monetary inflation and the mimicking of US interest-rate policy, both of which are required to maintain the HK$-US$ peg, explain Hong Kong’s real estate bubble and high cost of living. The HK$-US$ peg hasn’t made sense for a long time and has become the main cause of a huge inflation problem in Hong Kong.

5) Considering the relatively fast pace of Australia’s money-supply growth and the A$’s resulting over-valuation, it’s remarkable that the A$’s exchange rate stayed so high for so long. The reason it didn’t buckle sooner is that the commodity price trend tends to overwhelm all other influences on the A$’s trend. This is illustrated by the following chart of the A$ and the Continuous Commodity Index Fund (GCC). An implication is that almost regardless of its inflation rate, the A$ will turn higher at around the same time as the general commodity price trend turns higher, which, by the way, probably just happened or will happen within the next few months.

A$_GCC_210515

Print This Post Print This Post