A basic misunderstanding about saving

Print This Post Print This Post

A basic misunderstanding about saving

Keith Weiner often posts thought-provoking stuff at his Monetary Metals blog. A recent post entitled “Interest – Inflation = #REF” is certainly thought-provoking, although it is also mostly wrong. It is mostly wrong because it is based on a fundamental misunderstanding about saving.

Before I get to the main point, I’ll take issue with the following paragraph from Keith’s post:

Normally, you don’t spend your savings, only the income on it. In ancient times, people had to hoard a commodity like salt when they worked. In retirement, they sold it to buy food. Modern economies evolved beyond that, with the development of interest. Retirees should not have to liquidate their life savings.

Who says you shouldn’t have to spend your savings? One of the main reasons to save today is so that you can spend more in the future. Also, interest isn’t a modern development, it has been inherent in economic activity since the dawn of economic activity.

Now, the main point: When people save money, it’s not actually money that they want to save. Money is just a medium of exchange. What they want to save is purchasing power (PP). For example, if I have a million dollars of savings to live on over the next 20 years, what matters to me is what the money buys now and what it will probably buy in the future. If a million dollars is currently enough to buy a mansion in the best part of town and if a dollar is likely to maintain its PP over the next 20 years, then I’ll probably be able to live quite comfortably on my savings. However, if a million dollars only buys me a loaf of bread, then I have a problem.

A consequence is that, contrary to the assertion in Keith’s post, the real interest rate is very important to the average retiree. The easiest way to further explain why is via a hypothetical example.

Fred, our hypothetical retiree, has $1M of savings at Year 0. At the dollar’s current purchasing power his cost of living is $20K per year. Also, the interest rate that he receives on his savings is ZERO, but the dollar is gaining PP at the rate of 5% per year.

At Year 1, Fred’s monetary savings will have declined to $980K, because he spent $20K and received no interest. However, $980K now has the same PP that $1029K had a year earlier. That is, over the course of the year Fred’s PP increased by 29K Year 0 dollars. Furthermore, his annual living expense will have declined to $19K.

At Year 2, Fred’s monetary savings will have declined to $961K, because he spent $19K and received no interest. However, $961K now has the same PP that $1059K had at Year 0.

That is, after 2 years of receiving no nominal interest on his savings, our hypothetical retiree is in a significantly stronger financial position. Thanks to the receipt of a positive real interest rate he now has more purchasing power than he started with. The fact that he has less currency units is irrelevant.

I could provide a second hypothetical example of a retiree who, despite earning a superficially-healthy positive nominal interest rate and ending each year with the same or more currency units, has a worsening financial position over time thanks to a negative real interest rate. I could, but I won’t.

The upshot is that the real interest rate is not only important, for savers and investors it is of greater importance than the nominal interest rate. The problem, today, is not only that central banks have pushed the nominal short-term interest rate down to near zero, it’s also that they have done this while reducing the PP of money. The great sucking sound is wealth being siphoned from savers via negative real interest rates.

Print This Post Print This Post

The Emotion Pendulum

(This post is an excerpt from a recent TSI commentary.)

The stock market is not a machine that assigns prices based on a calm and objective assessment of value. In fact, when it comes to value the stock market is totally clueless.

This reality is contrary to the way that many analysts portray the market. They talk about the stock market as if it were an all-seeing, all-knowing oracle, but if that were true then dramatic price adjustments would never occur. That such price adjustments occur quite often reflects the reality that the stock market is a manic-depressive mob that spends a lot of its time being either far too optimistic or far too pessimistic.

The stock market can aptly be viewed as an emotion pendulum — the further it swings in one direction the closer it comes to swinging back in the other direction. Unfortunately, there are no rigid benchmarks and we can never be sure in real time that the pendulum has swung as far in one direction as it is going to go. There’s always the possibility that it will swing a bit further.

Also, the swings in the pendulum are greatly amplified by the actions of the central bank. Due to the central bank’s manipulation of the money supply and interest rates, valuations are able to go much higher during the up-swings than would otherwise be possible. Since the size of the bust is usually proportional to the size of the preceding boom, this sets the stage for larger down-swings than would otherwise be possible.

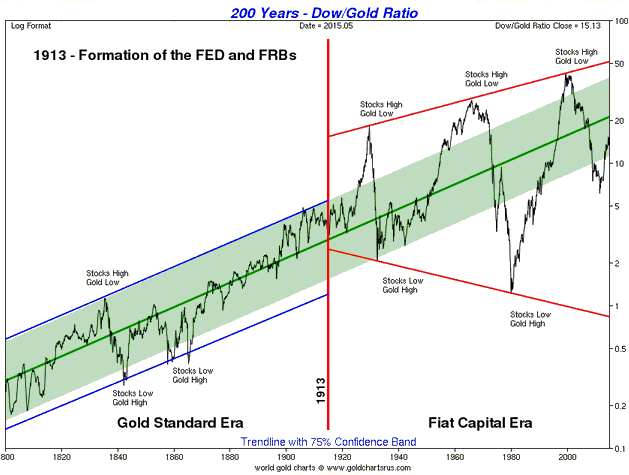
The following monthly chart of the Dow/Gold ratio (from Sharelynx.com) clearly shows the increasing magnitude of the swings since the 1913 birth of the US Federal Reserve.

Print This Post Print This Post

Rallying against the Chinese invasion of Australia

According to the fellow in the video shown below, the Chinese are invading Australia. It isn’t a military invasion, it’s an economic invasion that involves the buying-up of Australian real estate and has caused young Australian families to be priced out of the property market. The solution, apparently, is for the Australian federal government to stop turning a blind eye to this flood of foreign investment and, instead, to put a stop to it, thus resuscitating the “Australian dream”. Unfortunately, the star of the video is both ethically and economically wrong. He is ethically wrong because he is advocating the widespread violation of property rights (he wants the government to dictate who Australian property owners can sell to, with the particular aim of preventing the sale of property to buyers who live in China), but it’s the economic error I’m going to deal with in this post.

Our ‘the-government-oughta-do-something-to-stop-the-Chinese-real-estate-invasion’ protest organiser and You-Tuber is unaware of two important economic realities, the first and lesser important of which is that Australia runs a large current-account deficit. This deficit, which comprises dividend payments, interest payments on foreign debt and a surplus of imports over exports, is running at around A$40B per year. This means that about $40B per year is ‘flowing’ out of the country on the current account, which means that about $40B/year of new investment MUST flow into the country (since nobody has any use for Australian dollars outside Australia). In other words, the current account deficit necessitates $40B per year of net foreign investment, approximately a quarter of which goes into real estate.

The more important economic reality of which our irrepressible video presenter is unaware is Australia’s rapid rate of monetary inflation. Thanks to the activities of the Reserve Bank of Australia (RBA) and the commercial banks, the supply of Australian dollars has risen by 13% over the past 12 months and 44% over the past 4 years. With this rate of money-supply growth and low interest rates it is no wonder that houses have become very expensive. With this monetary backdrop, houses would almost certainly have become very expensive even if China didn’t exist. Furthermore, a rapid rate of monetary inflation tends to increase the current account deficit and weaken the currency on the foreign exchange market, thus putting more of the currency in the hands of foreign investors and simultaneously making domestic property prices look cheaper to foreign investors.

So, if the guy in above video had a better understanding of economics he’d be organising a protest outside the RBA headquarters instead of the Chinese consulate.

Print This Post Print This Post

The ‘great’ gold debate

The title of this post refers to the debate between Jeff Clark and Harry Dent about gold’s prospects over the next 2 years, with Harry Dent arguing for a collapse in the gold price to less than $700/oz and Jeff Clark arguing in favour of a bullish outcome. I put inverted commas around the word great, because neither participant in this debate made a good argument. However, while the Clark side of the debate could have been a lot better, the Dent side was a stream of complete nonsense. In this post I’ll deal with a couple of the flaws in Dent’s analysis and also briefly address the extremely persistent deflation fantasy that lies at the core of Dent’s latest big prediction*.

An important point to understand is that gold is not now, and has never been, a play on “CPI inflation”. As I stated in an earlier post: “Gold is a play on the economic weakness caused by bad policy and on declining confidence in the banking establishment (led by the Fed in the US). That’s why cyclical gold bull markets are invariably born of banking/financial crisis and/or recession, and why a cyclical gold bull market is more likely to begin amidst rising deflation fear than rising inflation fear.” Jeff Clark barely touches on this key point, while Harry Dent believes that the point is invalidated by the fact that the gold price fell by 33% during part of the 2008 financial crisis.

Harry Dent keeps returning to gold’s performance during 2008 and provides no other historical examples of gold performing poorly in times of financial crisis. He therefore either has very little knowledge of gold’s historical record or he believes that hundreds of years of history were negated by what happened during 2008. Either way, he is misinformed, because gold outperformed the US$ over the course of 2008. The 33% decline is from the best level of the year to the worst level of the year, but even this sizeable peak-to-trough loss was fully eradicated by the first quarter of 2009. Moreover, if we consider the entire Global Financial Crisis (GFC), with the 10th October 2007 closing high for the S&P500 marking its beginning and the 10th March 2009 closing low for the S&P500 marking its end, we find that gold gained 24% in US$ terms and 34% in euro terms over the course of the crisis.

Information that must always be taken into account when assessing gold’s performance in reaction to events is the gold-price starting point. The reason that gold was initially hit hard in US$ terms during the general market crash of 2008-2009 is largely due to the US$ gold price being ‘overbought’ and at a multi-decade high just prior to the crash, which is obviously not the case today. Furthermore, as I mentioned above it quickly recouped its losses.

And information that must be taken into account when assessing the performances of all the financial markets during the GFC of 2007-2009 is that the Fed did not begin to pump-up the US money supply (properly measured via TMS) until September of 2008. From September of 2007 through to August of 2008 the Fed cut interest rates, but the monetary inflation rate remained at a low level. Since there is no longer any scope to cut interest rates, it’s a virtual certainty that the Fed’s initial response to a deflation scare in the not-too-distant future would involve ramping-up the money pumps.

In addition to presenting gold’s GFC performance in a misleading way, there are numerous problems with Dent’s argument. Due to time constraints I’m only going to deal with one of them. Here’s the relevant excerpt:

The gold bug camp is constantly telling us that governments are debasing our currency, especially the almighty US dollar and destroying the value so that the dollar is not a good store of value. I 100% disagree.

Here’s an analogy to explain: Since its invention in 1971, the microchip has been multiplied by the trillions, creating a revolution in human communications. Its evolution is a crystal-clear sign of progress and of a higher standard of living. Translating that back to the dollar argument, if the exponential multiplication of the microchip was (is) a good thing, why would the multiplication of dollars not also be a sign of progress that similarly fosters a revolution in urbanization, more complex and rich specialization of skills, and an improved standard of living? Increasing urbanization leads to rising affluence and the need for greater dollars for transactions in a more complex urban society!

This may be the stupidest economics-related comment I’ve ever read from a trained economist, which is saying something considering the competition. It implies that he doesn’t know the difference between a rise in the quantity of the medium of exchange and a rise in the quantity of real wealth. It implies that he sees no difference between the private sector increasing the supply of labour-saving or life-sustaining or life-enhancing products and central banks creating new money out of nothing. Also, he apparently perceives the factual decline in the US dollar’s purchasing power as a goldbug delusion.

Harry Dent should not be taken seriously, but the view that deflation is coming should not be dismissed out of hand. Also, it is possible to make a legitimate gold-bearish argument, it’s just that Harry Dent hasn’t done it.

Under the current monetary system and the theories that dominate central banking, true deflation — such as occurred in the US during 1930-1932 — has a near-zero probability of happening. In the future there could (almost certainly will) be changes to the monetary system and/or the political environment that pave the way for true deflation, but that’s not something that has a realistic chance of happening over the next two years. In the meantime, there will probably be another deflation scare.

While it’s in progress a deflation scare will look and feel like 1930s-style deflation to most people. The difference is that you don’t get the economic ‘reset’ that would be caused by true deflation. Instead, policy-makers react to the scare by 1) aggressively injecting new money into the economy, 2) ensuring that the total volume of credit continues to grow, and 3) generally doing whatever it takes to prop-up prices. In doing so they add new imbalances to the existing imbalances.

Deflation scares are very bullish for gold. That’s why the deflation scare of 2001-2002 set in motion a large multi-year advance in the gold price and why the deflation scare of 2007-2009 set in motion a large multi-year advance in the gold price. If another deflation scare gets underway this year then so, in all likelihood, will another large multi-year advance in the gold price.

Looking out over the coming 1-2 years, the risk for gold isn’t that there will be true deflation, because that’s a virtual impossibility under the current monetary set-up. Nor is the realistic possibility of a deflation scare a risk for gold, since such a development would create a very gold-bullish fundamental backdrop. Rather, the risk for gold is a continuation of the monetary-inflation-fueled boom of the past few years.

In effect, the main risk for gold is an economic outcome that is almost the OPPOSITE of what Harry Dent is predicting.

*Harry Dent’s modus operandi is to come out with a new ‘big prediction’ almost every year. This creates a media buzz that facilitates the sale of books. If a big prediction doesn’t pan out, no problem — just make another one. Eventually, one will hit the mark. In the early-1990s he got lucky and correctly predicted the ensuing boom (it was blind luck because his reasoning was wrong). If he gets lucky again, he’ll have a track record to shout from the hilltops.

Print This Post Print This Post
ASS Economics

To the Keynesian economist, the world of economics is a sequence of random events — an endless stream of anecdotes. Things don’t happen for any rhyme or reason, they just happen. And when they happen the economist’s first job is to come up with an explanation by looking at the news of the day, because there will always be current events that can be blamed for any positive or negative developments.

It’s futile to look any deeper, for example, to consider how policies such as meddling with interest rates might have influenced investment decisions, because, even though the real-world economy involves millions of individuals making decisions for a myriad of reasons, the individual actors within the economy supposedly form an amorphous mass that shifts about for unfathomable reasons. In fact, in the Keynesian world the economy can be likened to a giant bathtub that periodically fills up and empties out for reasons that can’t possibly be understood, although if an explanation that goes beyond the news of the day is needed the economist can always fall back on “aggregate demand” or its more emotional cousin — “animal spirits”. Specifically, a slowing economy can be said to be the result of falling “aggregate demand”, and when the pace of economic activity is rapid it can be said to be the result of surging “animal spirits”. There’s no need to try to explain the changes in these mysterious entities, because they are inexplicable. They just happen.

Having explained what’s happening to the economy by pointing at seemingly random/unpredictable events or citing unfathomable changes in “aggregate demand”, the economist’s second job is to recommend a course of action. And since the economy can supposedly be likened to a bathtub filled with an amorphous liquid, the level of which periodically rises and falls, it’s up to the economist to suggest ways that add liquid when the level is too low and drain liquid when the level is too high.

Fortunately, adding and draining liquid is very easy to do. For example, to add liquid all that has to be done is for the government to increase its spending and/or for the central bank to create some money out of nothing. It doesn’t matter that the government’s spending is unproductive and that the central bank’s money-pumping falsifies the price signals upon which the market relies; it only matters that more liquid is added to the bathtub.

This approach to economics might seem ad-hoc. It might seem superficial. And it might seem short-sighted. That’s because it is all of these things, which is why Keynesian Economics should be re-branded ASS (Ad-hoc, Superficial and Shortsighted) Economics.

Print This Post Print This Post

Gold is not a play on “CPI inflation”

I have never been in the camp that exclaims “buy gold because the US is headed for hyperinflation!”. Instead, at every step along the way since the inauguration of the TSI web site in 2000 my view has been that the probability of the US experiencing hyperinflation within the next 2 years — on matters such as this there is no point trying to look ahead more than 2 years — is close to zero. That is still my view. In other words, I think that the US has a roughly 0% probability of experiencing hyperinflation within the next 2 years. Furthermore, at no time over the past 15 years have I suggested being ‘long’ gold due to the prospect of a rapid rise in the CPI. This is partly because at no time during this period, including the present, has a rapid rise in the CPI seemed like a high-probability intermediate-term outcome, but it is mainly because gold has never been and is never likely to be a play on “CPI inflation”.

Gold is a play on the economic weakness caused by bad policy and on declining confidence in the banking establishment (led by the Fed in the US). That’s why cyclical gold bull markets are invariably born of banking/financial crisis and/or recession, and why a cyclical gold bull market is more likely to begin amidst rising deflation fear than rising inflation fear.

There are times when the declining economic/monetary confidence that boosts the investment demand for gold is linked to expectations of a rapid increase in “price inflation”, but it certainly doesn’t have to be. For example, the entire run-up in the gold price from its 2001 bottom to its 2011 peak had nothing to do with the CPI. Also, an increase in the rate of “CPI inflation” would only ever be bullish for gold to the extent that it brought about declining confidence in the economy or the banking establishment, as indicated by credit spreads, real interest rates, the BKX/SPX ratio and the yield curve. Since it’s possible for the CPI to accelerate upward without a significant decline in confidence, it’s possible that an upward acceleration in the CPI would not be bullish for gold.

The bottom line is that as far as the gold market is concerned, the CPI is more of a distraction than a driver. 

Print This Post Print This Post

Bernanke’s logical fallacies and self contradictions

Former Fed chief Ben Bernanke now has a blog. This is mostly good news, because he will certainly do less damage as a blogger than he did as a monetary central planner. However, it means that he is still promoting bad ideas.

I doubt that I’ll be a regular reader of Bernanke’s blog, because his thinking on economics is riddled with logical fallacies. Some of these fallacies were on display in his second post, which was titled “Why are interest rates so low?“. Some examples are discussed below.

In the fourth paragraph Bernanke states: “The Fed’s ability to affect real rates of return, especially longer-term real rates, is transitory and limited. Except in the short run, real interest rates are determined by a wide range of economic factors, including prospects for economic growth — not by the Fed.” However, earlier in the same paragraph he states that the real interest rate is the nominal interest rate minus the inflation rate, that the Fed sets the benchmark nominal short-term interest rate, that the Fed’s policies are the primary determinant of inflation and inflation expectations over the longer term, and that inflation trends affect interest rates. Also, the Fed clearly attempts to influence the prospects for economic growth. So, by Bernanke’s own admission the Fed exerts considerable control over the “real” interest rate. In other words, he contradicts himself.

A bit further down the page he states: “…[the Fed's] task amounts to using its influence over market interest rates to push those rates toward levels consistent with the equilibrium rate, or — more realistically — its best estimate of the equilibrium rate, which is not directly observable.” And: “[the Fed] must try to push market rates toward levels consistent with the underlying equilibrium rate.

So, having said in the fourth paragraph that the Fed has minimal control over the real interest rate and then contradicting himself by saying that the Fed controls or influences pretty much everything that goes into determining the real interest rate, he subsequently says that the Fed’s task is to push the market interest rate towards the “equilibrium rate”, which, by the way, is unobservable. Now, the so-called “equilibrium rate” is the REAL interest rate consistent with optimum usage of resources. In other words, he’s now saying that the Fed’s task is to push the REAL market interest rate as close as possible to an unobservable/unknowable “equilibrium rate”, having started out by claiming that the Fed doesn’t determine the real interest rate. I wish he would at least keep his story straight!

As an aside, the equilibrium rate is the rate that would bring the supply of and demand for money, capital and other resources into balance, which is the real rate that would be sought by the market in the absence of the Fed. In other words, if the Fed did its job to perfection, which is not possible, then it would be constantly adjusting its monetary levers to ensure that the market interest rate was where it would be if the Fed didn’t exist.

Bernanke goes on to say that today’s US interest rates aren’t artificially low, they are naturally low. Apparently, the Fed’s ultra-low interest rate setting is a reflection of a naturally-low interest-rate environment, not the other way around. This prompts the question: Why, then, can’t the Fed just get out of the way? To put it another way, if default-free nominal interest rates would be near zero and real interest rates would be negative in the absence of the Fed’s gigantic boot, then why can’t the Fed allow interest rates to be controlled by market forces?

It seems that Bernanke cleverly anticipated this line of thinking, because in a beautiful example of circular logic he says “The Fed’s actions determine the money supply and thus short-term interest rates; it [therefore] has no choice but to set the short-term interest rate somewhere.” That is, the Fed can’t leave the short-term interest rate alone, because if the Fed exists it will inevitably act in a way that alters the short-term interest rate. Clearly, Ben Bernanke can’t even imagine a world in which there is no central bank.

Ben Bernanke ends his post by putting aside all the talk in paragraphs 5 through 9 about the Fed’s efforts to control the real market interest rate and by reiterating his comment (from paragraph 4) that the Fed doesn’t determine the real interest rate. As a final piece of evidence he notes that interest rates are low throughout the world, not just in the US, but forgets to mention that central banks throughout the world are behaving the same way as the Fed.

Print This Post Print This Post

If Keynesians were consistent they’d be Communists

If the free market can’t be trusted to set the most important price in the economy (the price of credit) and if government intervention can help the economy work better, then total government control of the economy must be the optimum situation. Therefore, if Keynesians were consistent they’d advocate for either Communism or Fascism.

In practical terms, Keynesian economics, which is the type of economics that dominates policy-making throughout the world today, involves using monetary and fiscal policy to ‘manage’ the economy. The overarching idea is that a free market is inherently unstable and that by modulating interest rates and something called “aggregate demand” the government can keep the economy on a smooth upward path. The fact that the results of putting this idea into practice have typically been the opposite of what was predicted doesn’t, according the Keynesians, indicate a major flaw in the underlying concept; it just means that the right people weren’t in charge.

Anyhow, the purpose of this post isn’t to argue against Keynesian economic theories, it’s to make the point that completely logical proponents of these theories would recommend a Communist or a Fascist political system. The reason is that these are the political systems that are most consistent with Keynesian economic theory.

As an aside, I’m applying the word “theory” very loosely to what the Keynesians believe, because what they believe is not encompassed by a coherent set of principles. It is more like an endless stream of anecdotes than a theory. Actually, it is a bit like Elliot Wave (EW) analysis. In the same way that EW analysis can always explain what happened in the past but is not useful when it comes to explaining the present or making predictions, Keynesians are always able to come up with an anecdote that explains why historical performance, while seemingly being totally at odds with their theories, fits perfectly into their theoretical construct after the special set of circumstances associated with the time period in question is taken into account. Since there are special circumstances associated with every period, Keynesians will always be able to come up with anecdotal explanations for why things didn’t pan out as expected. There is never any perceived need to question the underlying ideas.

Getting back to my point, consider the control of interest rates by a central planning agency called the Central Bank. All Keynesians (and pretty much everyone apart from the “Austrians”) believe this price-setting power to be not only legitimate and appropriate, but also necessary to facilitate the smooth running of the economy. OK, but given that the price of credit is influenced by a greater number of variables than any other price and would therefore be the most difficult price for a central planner to get right, if central planners can do a better job of setting interest rates than a free market then it stands to reason that central planners could do a better job than the free market of setting all prices. Therefore, anyone who claims that it is right that a central bank controls interest rates would, if they were being consistent, also claim that similar agencies should be established to control all other prices.

Now consider the Keynesian notion that the government should modulate “aggregate demand” to create a more stable economy. The thinking here is that 1) a free-market-economy periodically gets ahead of itself and then plunges into an abyss, 2) dramatic economic oscillations are caused by largely unfathomable changes in “aggregate demand”, with the devastating downswing the result of a mysterious collapse in “aggregate demand”, and 3) by adding and removing demand via its own spending, the government can smooth the transition from one boom to the next. In effect, the economy is treated as if it were a swimming pool that sometimes, for no well-defined reason, loses a lot of water, while the government is treated as if it were an institution capable of replenishing the water, even though in the real world the government has no water of its own.

If the economy really were like an amorphous mass of liquid that could be manipulated, via changes in government spending, in whatever direction was needed at the time to create the optimum outcome, then total government control of the economy would definitely work.

The upshot is that if uber-Keynesian Paul Krugman went on television and argued in favour of a Soviet-style system, he would be taking his economic principles to their natural political conclusions. In doing so he would be totally logical. He would be totally consistent. And he would be totally discredited.

Print This Post Print This Post

Economics Myths

This is an update of something I wrote 12 months ago. I began the original piece with the goal of explaining where I agreed and disagreed with an article by Cullen Roche titled “The Biggest Myths in Economics“, but I ended up referring to the Roche article within the context of my own list of economics myths. Here’s my list. Unfortunately, it is by no means comprehensive.

Myth #1: Banks “lend reserves”

This is the second myth in the Roche article. He is 100% correct when he states:

…banks don’t make lending decisions based on the quantity of reserves they hold. Banks lend to creditworthy customers who have demand for loans. If there’s no demand for loans it really doesn’t matter whether the bank wants to make loans. Not that it could “lend out” its reserve anyhow. Reserves are held in the interbank system. The only place reserves go is to other banks. In other words, reserves don’t leave the banking system so the entire concept of the money multiplier and banks “lending reserves” is misleading.

Reserves held at the Fed cannot under any circumstances be loaned into the economy, and any analyst who takes a cursory look at historical US bank lending and reserves data will see that there has been no relationship between bank lending and bank reserves for at least the past few decades. I live in hope that the economics textbooks will eventually be updated to reflect this reality, although compared to some of the other errors in the typical economics textbook this one is minor.

Myth #2: The Fed’s QE boosts bank reserves, but doesn’t boost the money supply

Anyone who believes that the Fed’s QE adds to bank reserves but not the money supply does not understand the mechanics of the asset monetisation process. It’s a fact that for every dollar of assets purchased by the Fed as part of its QE, one dollar is added to bank reserves at the Fed and one dollar is added to demand deposits within the economy (the demand deposits of the securities dealers that sell the assets to the Fed). Refer to “How the Fed’s QE creates money” for more details.

A related myth is that the Fed is powerless to expand the money supply if the commercial banks aren’t expanding their loan books. It is certainly the case that prior to 2008 almost all new money was loaned into existence by commercial banks, but this wasn’t because the Fed didn’t have the ability to directly expand the money supply. From the Fed’s perspective, there was simply no reason to use its direct money-creation ability prior to September of 2008.

Myth #3: The US government is running out of money and must pay back the national debt

This is the third myth in the Roche article. The reality is that no government will ever run short of money as long as its spending and debt are denominated in a currency it can create, either directly or indirectly (via a central bank). The lack of any normal financial limit on the extent of government spending and borrowing is a very bad thing.

Myth #4: The federal debt is a bill that each citizen is liable for

This is similar to the fourth myth in the Roche article, although the Roche explanation contains statements that are either misleading or wrong. Before I take issue with one of these statements, I note that a popular scare tactic is to divide the total government debt by the population to come up with a figure that supposedly represents a liability of every man, woman and child in the country. For example, according to http://www.usdebtclock.org/ the US Federal debt amounts to about $57,000 per citizen or $154,000 per taxpayer. For most people this is a lot of money, but it doesn’t make sense to look at the government debt in this way. Rightly or wrongly, the government’s debt will never be paid back. It will grow indefinitely, or at least until it gets defaulted on. There are negative indirect consequences of a large government debt, but it is wrong to think of this debt as something that will have to be repaid by current taxpayers or future taxpayers.

The Roche statement that we take issue with is: “…the government doesn’t necessarily reduce our children’s living standards by issuing debt. In fact, the national debt is also a big chunk of the private sector’s savings so these assets are, in a big way, a private sector benefit.

The government doesn’t create wealth and therefore cannot possibly create real savings. To put it another way, real savings cannot be created out of thin air by the issuing of government debt. What happens when the government issues debt is that savings are diverted from the private sector to the government. In any single instance the government will not necessarily use the savings less efficiently than they would have been used by the private sector, but logic and a veritable mountain of historical evidence tells us that, on average, government spending is less productive than private-sector spending. In fact, government spending is often COUNTER-productive.

Myth #5: QE is not inflationary

My fifth myth is the opposite of Cullen Roche’s fifth myth. According to Roche, it’s a myth that QE is inflationary. His argument:

Quantitative Easing (QE) … involves the Fed expanding its balance sheet in order to alter the composition of the private sector’s balance sheet. This means the Fed is creating new money and buying private sector assets like MBS or T-bonds. When the Fed buys these assets it is technically “printing” new money, but it is also effectively “unprinting” the T-bond or MBS from the private sector. When people call QE “money printing” they imply that there is magically more money in the private sector which will chase more goods which will lead to higher inflation. But since QE doesn’t change the private sector’s net worth (because it’s a simple swap) the operation is actually a lot more like changing a savings account into a checking account. This isn’t “money printing” in the sense that some imply.

There is a lot wrong with this argument. For starters, in one sentence he says “when people call QE “money printing” they imply that there is magically more money in the private sector“, and yet in the preceding sentence he states that the Fed adds new money to the economy when it purchases assets. So, there is no need for anyone to imply that there is “magically more money” as a result of QE, because, as Mr. Roche himself admits, the supply of money really does increase as a result of QE. (As an aside, recall that in the previous myth Mr. Roche implied that the government could magically increase the private sector’s savings by going further into debt.)

The instant after the Fed monetises some of the private sector’s assets there will be more money, the same quantity of goods and less assets in the economy. Until the laws of supply and demand are repealed this will definitely have an inflationary effect, because there will now be more money ‘chasing’ the same quantity of goods and a smaller quantity of assets. However, the details of the effect will be impossible to predict, because the details will depend on how the new money is used. We can be confident that the initial effect of the new money will be to elevate the prices of the sorts of assets that were bought by the Fed, but what happens after that will depend on what the first receivers of the new money (the sellers of assets to the Fed) do, and then on what the second receivers of the new money do, and so on. It’s a high-probability bet that the new money will eventually work its way through the economy and lead to the sort of “price inflation” that the average economist worries about, but this could be many years down the track. This type of “price inflation” problem hasn’t emerged yet and probably won’t emerge this year, but the price-related effects of the Fed’s QE should be blatantly obvious to any rational observer. One of the most obvious is that despite being 7 years into a so-called “great de-leveraging”, the US stock market recently traded at the second-highest valuation in its history (by multiple valuation measures with good long-term track records, it was only near the peak of the dot.com/tech/telecom bubble that the market was more expensive).

Myth #6: Hyperinflation can be caused by factors unrelated to money

This is almost the opposite of Roche’s sixth myth. He argues that hyperinflation is not caused by “money printing”, but is, instead, caused by events such as the collapse of production, the loss of a war, and regime change or collapse.

While the events mentioned by Cullen Roche tend to precede hyperinflation, they only do so when they prompt a huge increase in the money supply. To put it another way, if these events do not lead to a huge increase in the money supply then they will not be followed by hyperinflation.

The fact is that hyperinflation requires both a large increase in the supply of money and a large decline in the desire to hold money. Over the past several years there was a large increase in the US money supply, although certainly not large enough to cause hyperinflation, along with an increase in the desire to hold money that has partially offset the supply increase.

Myth #7: Increased government spending and borrowing drives up interest rates

This is almost the same as Roche’s seventh myth. An increase in government spending and borrowing makes the economy less efficient and causes long-term economic progress to be slower than it would have been, but it doesn’t necessarily drive up the yields on government bonds. This is especially so during periods when deep-pocketed price-insensitive bond buyers such as the Fed and other central banks are very active in the market.

Myth #8: The Fed provides a net benefit to the US economy

It never ceases to amaze me that people who fully comprehend why it would make no sense to have central planners setting the price of eggs believe that it is a good idea to have central planners setting the price of credit.

The real reason for the Fed’s creation is of secondary importance. No conspiracy theory is required, because the fact is that even if the Fed were established with the best of intentions and even if it were managed by knowledgeable people with the best of intentions, it would be a bad idea. This is because the Fed falsifies the price signals that guide business and other investment decisions.

Myth #9: Different economic theories are needed in different circumstances

The myth that different times call for different economic theories, for example, that the valid theories of normal times must be discarded and replaced with other theories during economic depressions, has been popularised by Paul Krugman. However, he has only gone down this track because he is in the business of promoting an illogical theory.

A good economic theory will work, that is, it will explain why things happened the way they did and provide generally correct guidance about the likely future direct and indirect effects of current actions, under all circumstances. It will work for an individual on a desert island, it will work in a rural village and it will work in a bustling metropolis. It will work during periods of strong economic growth and it will work during depressions.

Myth #10: The economy is driven by changes in aggregate demand

The notion that the economy is driven by changes in aggregate demand, with recessions/depressions caused by mysterious declines in aggregate demand and periods of strong growth caused by equally mysterious increases in aggregate demand, is the basis of the Keynesian religion and the justification for countless counter-productive monetary and fiscal policies.

Rising consumption is an effect, not a cause, of economic growth. More specifically, an increase in consumption is at the end of a three-step sequence that has as its first two steps an increase in saving/investment and an increase in production. For higher consumption to be sustainable it MUST be funded by an increase in production. By the same token, an artificial boost in consumption (demand) caused by monetary and/or fiscal stimulus will be both unsustainable and wasteful. It is like eating the seed corn — it helps satisfy hunger in the short-term, but ultimately results in less food.

A related point is that there has never been “insufficient aggregate demand” and there never will be “insufficient aggregate demand”, at least not until everyone has everything they want. In the real world, the ability to demand/consume is limited only by the ability to produce the right things. Consequently, what is typically diagnosed as “insufficient aggregate demand” is actually insufficient production, or, to put it more accurately, a production-consumption mismatch resulting from the economy becoming geared-up to produce too many of some things and not enough of others.

Myth #11: Consumer spending is about 70% of the US economy

This and the previous myth are related, in that the wrong belief that consumer spending is 65%-70% of the total economy lends credence to the wrong belief that economic growth is caused by increasing consumption.

Consumer spending involves taking something out of the economy, so it is mathematically impossible for consumer spending to be more than 50% of the economy. Consumer spending does account for about two-thirds of US GDP, but that’s only because the GDP calculation omits about half the economy (GDP leaves out all intermediate stages of production). Due to the fact that the GDP calculation includes 100% of consumer spending and only about half the total economy, 35% would be a more accurate estimate of US consumer spending as a percentage of the total US economy.

Myth #12: Inflation is not a problem unless the CPI is rising quickly

The conventional wisdom that “inflation” is not a major concern unless the CPI is rising quickly is not only wrong, it is dangerous. It is wrong because monetary inflation affects different prices in different ways at different times, but the resultant price distortions always end up causing economic problems. It is dangerous because it leads people to believe that there are no serious adverse consequences of central-bank money conjuring during periods when the prices included in the CPI are not among the prices that are being driven skyward by the expanding money supply.

Myth #13: Interest rates are the price of money

People who comment on economics and the financial markets often state that the interest rate is the price of money. This is wrong.

The price of money is what money can buy. For example, if an apple is sold for $1, then the price of a unit of money (one dollar) in that transaction is one apple. To put it another way, the price of money is the purchasing power of money. It rises and falls in response to changes in the supply of and the demand for money and changes in the supply of and the demand for the things for which money is traded.

The interest rate, on the other hand, can be correctly viewed as either the price of credit or the price of time. In the case where there is no risk of default and no risk of purchasing-power loss due to inflation, the interest rate will be determined by the perceived benefit of getting money immediately versus getting it at some future time.

Myth #14: Policymakers should try to boost employment and real wages

The conventional wisdom that policies should be put in place to boost employment and real wages confuses cause and effect. Just as rising consumption is an effect, not a cause, of economic growth (refer to Myth #10), rising employment and real wages are effects of economic growth. For example, the rebound in the US economy from its 2009 trough wasn’t unusually weak due to the unusually slow recovery in employment, there was, instead, an unusually slow recovery in employment because the economy’s rebound was much weaker than normal.

Consequently, the best way to get rising employment and real wages is to remove the obstacles to economic progress. The government and the central bank are by far the biggest obstacles, so minimising the government and eliminating the central bank would be effective.

Print This Post Print This Post

The SNB gets religion, sort of

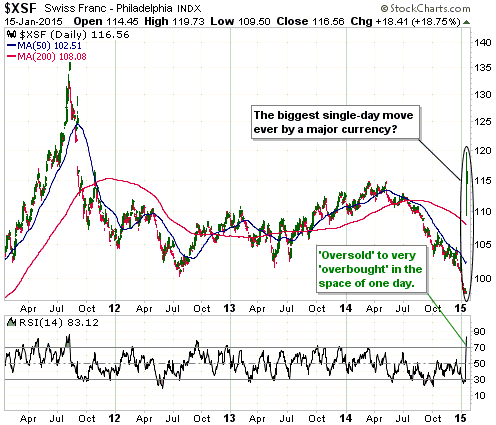
In a shot out of the blue, on Thursday 15th January the Swiss National Bank (SNB) suddenly removed the Swiss-Franc/Euro cap that was put in place in August of 2011. Due to the cap that was imposed by the SNB way back then, the SF has effectively been pegged to the euro over the past three-and-a-bit years. Since the SF was a chronically stronger currency than the euro, maintaining this peg forced the SNB to massively expand its balance sheet by monetising huge quantities of euro-denominated bonds.

It seems that the SNB belatedly came to see that continuing to peg the SF to the euro created the risk that the SF would become excessively weak and unstable. The sensible, but surprising, decision was therefore made to eliminate the peg. A result was a gigantic single-day surge in the SF relative to all other currencies, not just the euro. For example, the following chart shows that the SF gained almost 20% relative to the US$ on Thursday. As far as we know, this is the biggest single-day move by a major currency in at least 50 years.

It should be noted, however, that the SNB’s shift to a more prudent monetary stance was only half-hearted, because at the same time as it announced the removal of the SF/euro cap it also announced that official 3-month interest rates would be set between NEGATIVE 0.25% and NEGATIVE 1.25%. In effect, the SNB is saying that it will pay speculators to short the SF.

SF_150115

Print This Post Print This Post

Only “price inflation” will put an end to the insanity

Central banks will continue to create money in response to economic weakness until blatant “price inflation” stops them. This is why the US economic situation is all but guaranteed to deteriorate.

To explain, I point out that if the Fed had done nothing in response to the bust of 2000-2002 then there would have been a severe recession, but the economy would probably have made a full recovery by 2004 and there would have been no mortgage-credit/housing-investment bubble and therefore no 2007-2008 crisis. However, the Fed, in its wisdom and at the behest of intelligent idiots such as Paul Krugman and Paul McCulley, kept interest rates at artificially low levels for years and aggressively ramped up the money supply with the aim of speeding the recovery process. In doing so it fueled a further rapid expansion of debt and a new bubble.

If the Fed had done nothing when this new bubble inevitably burst in 2007-2008 then there would have been a more severe recession, but the US economy would probably have made a full recovery by 2010 or 2011. It would certainly not now be teetering on the verge of another devastating bust.

During 2001-2004 and again since 2008, the Fed felt free to encourage rapid increases in the supplies of money and credit because there were no obvious negative “price inflation” consequences to be seen by those who fixate on price indices such as the CPI. Therefore, the lack of an obvious “price inflation” problem in the US should be viewed as a threat, not a benefit. From the perspective of the people pulling the monetary levers, it provides carte blanche for more money-conjuring in response to economic weakness.

You see, from the collective perspective of the ‘master manipulators’ at the monetary politburo, creating money out of nothing is never a problem until it causes the general price level — which, by the way, can’t be measured, but that doesn’t stop them from pretending to measure it and coming up with figures upon which policies are based — to rise faster than some arbitrary number. They appear to have no inkling that the falsifying of interest rates and relative price signals distorts investment decisions and the structure of production in a way that leads to an economic bust that wipes out all the superficial gains made in response to the so-called monetary stimulus.

If money-pumping continues to be the knee-jerk reaction to every new bout of economic weakness, then a “price inflation” problem will eventually arise. The longer it takes to arise, the greater the amount of damage that will be done in the meantime.

Men of good will should therefore be hoping for an outbreak of “price inflation”, it seemingly being the only way to end the destructive policy-making.

Print This Post Print This Post

The “gold backwardation” (a.k.a. negative GOFO) storm in a teacup

This blog post is a slightly modified excerpt from a recent TSI commentary.

Back in July of last year I pointed out that in a world where official short-term interest rates are close to zero, some short-term market interest rates are also going to be very close to zero, and that, in such cases, interest-rate dips below zero could occur as a result of insignificant price fluctuations. A topical example at the time was “gold backwardation”, meaning the price of gold for immediate delivery moving above the price of gold for future delivery. Gold backwardation is still a topical example and, thanks to the persistence of near-zero official US$ interest rates, is still not significant. What I mean is that the “backwardation” has almost everything to do with the near-zero official short-term interest rate and almost nothing to do with gold supply/demand. So please, gold analysts, stop pretending otherwise!

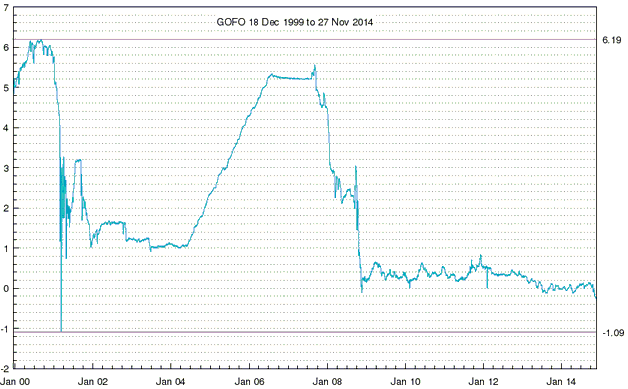
When the gold market is in backwardation, something called the Gold Forward Offered Rate (GOFO) will be negative. A negative GOFO effectively just means that it costs more for a major bank to borrow gold than to borrow US dollars for a short period. In a situation where the relevant short-term US$ interest rate (LIBOR) is close to zero, why would this be important or in any way strange?

The answer is that it wouldn’t be. What’s strange is an official US$ interest rate pegged near zero. Given this US$ interest rate situation, it is not at all surprising or meaningful that the GOFO periodically dips into negative territory and the gold market slips into “backwardation”.

The charts displayed below illustrate the point I’m attempting to make. The first chart shows the 1-month GOFO and the second chart shows the 1-month LIBOR. Notice that apart from a couple of spikes in one that don’t appear in the other, these charts are essentially identical. The message is that GOFO generally tracks LIBOR, so with the Fed having effectively pegged LIBOR near zero since late-2008 it would be normal for GOFO to fluctuate around zero and to sometimes be negative.

The upshot is that a negative GOFO (and, therefore, a “backwardated” gold market) would be a meaningful signal if LIBOR were at a more normal level (say, 3%), but with LIBOR near zero it should be expected that GOFO will periodically move below zero. In other words, there won’t be a useful signal from GOFO until official US$ interest rates move up to more normal — or at least up to less abnormal — levels.

Before ending this post, here are two related points on gold-linked interest rates:

First, the Gold Lease Rate (GLR) that you see quoted in various places is equal to LIBOR minus GOFO. It is a derived quantity and not the actual amount that is paid to borrow gold. The actual amount that any gold borrower pays in interest will be negotiated on a case-by-case basis with the gold lender and will NEVER be negative. In other words, although the derived GLR will sometimes go into negative territory, this doesn’t mean that people are being paid to borrow gold.

Second, a lower GOFO implies a higher (not lower) cost to borrow gold. GOFO’s recent dip into negative territory therefore implies that the cost to borrow gold has risen, although the percentage changes have been tiny and, as noted above, the lease rate paid by a specific borrower will generally not be the same as the GLR published by the LBMA and charted at web sites such as Kitco.com.

Print This Post Print This Post

Revisiting the Goldman Sachs $1050/oz gold forecast

This blog post is a slightly-modified excerpt from a recent TSI commentary.

At the beginning of this year, banking behemoth Goldman Sachs (GS) called for gold to end the year at around $1050/oz. I didn’t agree with this forecast at the time and still believe it to be an unlikely outcome (although less unlikely than it was a few months ago), but earlier this year I gave Goldman Sachs credit for at least looking in the right direction for clues as to what would happen to the gold price. In this respect the GS analysis was/is vastly superior to the analysis coming from many gold-bullish commentators.

Here’s what I wrote at TSI when dealing with this topic back in April:

GS’s analysis is superior to that of many gold bulls because it is focused on a genuine fundamental driver. While many gold-bullish analysts kid themselves that they can measure changes in demand and predict prices by adding up trading volumes and comparing one volume (e.g. the amount of gold being imported by China) to another volume (e.g. the amount of gold being sold by the mining industry), the GS analysts are considering the likely future performance of the US economy.

The GS bearish argument goes like this: Real US economic growth will accelerate over the next few quarters, while interest rates rise and inflation expectations remain low. If this happens, gold’s bear market will continue.

The logic in the above paragraph is flawless. If real US economic growth actually does accelerate over the next few quarters then a bearish view on the US$ gold price will turn out to be correct, almost regardless of what happens elsewhere in the world. The reason the GS outlook is probably going to be wrong is that the premise is wrong. Specifically, the US economy is more likely to be moribund than strong over the next few quarters. It’s a good bet that inflation expectations will remain low throughout this year, but real yields offered by US Treasuries are more likely to decline than rise due to signs of economic weakness and an increase in the popularity of ‘safe havens’ as the stock market trends downward.

I was right and GS was wrong about interest rates, in that both nominal and real US interest rates are lower today than they were in April. However, it is certainly fair to say that GS’s overall outlook as it pertains to the gold market has been closer to the mark than mine over the intervening period. This is primarily because economic confidence has risen, which is largely due to the continuing rise in the senior US stock indices.

So, regardless of whether or not gold ends up getting closer to GS’s $1050/oz target before year-end (I don’t think it will), I give GS credit for being mostly right for mostly the right reasons over the course of this year to date.

For their part, many gold bulls continue to look in the wrong direction for clues as to what the future holds in store. In particular, they continue to fixate on trading volumes, seemingly oblivious to the fact that for every net-buyer there is a net-seller and that the change in price is the only reliable indicator of whether the buyers or the sellers are the more motivated.

Print This Post Print This Post

First-hand impressions of the “Umbrella Movement”

I went to Hong Kong last weekend to get a first-hand look at the protests that are now commonly referred to as the “Umbrella Movement”. I went there believing that the protest movement had very little chance of achieving its main objective, which is to gain a ‘free and fair’ election process for Hong Kong, and came away with the same opinion.

The current protests are taking place in three parts of HK — in the streets around the central government offices in Admiralty (near Central on Hong Kong Island), along part of Nathan Road in Mong Kok (a major shopping area on the Kowloon side of HK), and Causeway Bay (a popular shopping/tourist area on Hong Kong Island). Protestors have blocked off some main streets using makeshift barricades and set up camp.

This must be one of the most peaceful mass protests ever. There are thousands of tents on the streets in the protest areas, but apart from numerous signs demanding “civil nomination” for political office and a few people giving speeches to small crowds at night-time, it doesn’t even seem like a protest. Rather, it seems as if a tent-dwelling community decided to make a home in the middle of a bustling metropolis. There are first-aid tents, covered study areas with many desks so that the students participating in the protest can keep up with their schoolwork, food and drink distribution points, and basic toilet/shower facilities. Also, the occupied areas are kept clean and tidy (there is no rubbish lying around). There was a police presence at Mong Kok (a few dozen uniformed police men and women were standing around the outside of the protest area looking bored), but not at Admiralty.

Here are some of the photos I took.

These photos show the tent cities:

OLYMPUS DIGITAL CAMERA OLYMPUS DIGITAL CAMERA OLYMPUS DIGITAL CAMERA OLYMPUS DIGITAL CAMERA OLYMPUS DIGITAL CAMERA OLYMPUS DIGITAL CAMERA OLYMPUS DIGITAL CAMERA OLYMPUS DIGITAL CAMERA OLYMPUS DIGITAL CAMERA

These photos show what is now known as “Lennon Wall”. The wall is part of an elevated road in Admiralty and is coated with countless thousands of messages of support.

OLYMPUS DIGITAL CAMERA OLYMPUS DIGITAL CAMERA OLYMPUS DIGITAL CAMERA OLYMPUS DIGITAL CAMERA

Finally, these photos show a first-aid tent, two covered study areas, and examples of the protestors’ artwork:

OLYMPUS DIGITAL CAMERAOLYMPUS DIGITAL CAMERA OLYMPUS DIGITAL CAMERA OLYMPUS DIGITAL CAMERA

OLYMPUS DIGITAL CAMERA

Overall, it appears to be business as usual in HK. Most people are going about their daily lives as if nothing out of the ordinary is going on, and Hong Kong has adjusted to having no vehicular access to the parts of the city occupied by the protestors. However, the situation could turn ugly, as it did for a few days in September, if the government makes another attempt to forcibly remove the protestors.

Although I couldn’t gauge the general level of support for the protest movement within the HK population, I suspect that most HK residents do not want to ‘rock the boat’ for the sake of greater political freedom. Furthermore, there is clearly some animosity towards the protestors on the part of HK people whose businesses have been disrupted by having some main streets blocked off. In one case, this animosity took the form of a high-volume tirade from a taxi driver when he was asked by my wife for his opinion about the protests.

Hong Kong’s rapidly-rising cost of living is one of the root causes of the discontent that led to the mass protests, but this problem would almost certainly not be addressed by ‘the people’ gaining more influence over who occupies the top political offices. The reason is that hardly anyone involved in the protest movement understands that the high cost of living is due to HK being crushed between the inflationary policies of the US and China.

Thanks to the HK dollar’s peg to the US dollar, HK’s monetary authority essentially follows the US Federal Reserve. This means that despite the steep upward trend in HK prices, interest rates are still being held near zero and the money supply is still being inflated at a brisk pace (it is up by 15% over the past 12 months). At the same time, as a result of the appreciation of the Yuan relative to the US$ and the large price rises in China’s major cities courtesy of rampant monetary inflation in that country, prices in HK still appear reasonable to the mainland Chinese who continue to flood into HK to spend money.

Hong Kong’s “inflation” problem looks destined to get worse over the coming 12 months, which could lead to more widespread support for the “Umbrella Movement”. But in the absence of a general understanding of the nature of the problem, taking a step in the direction of democracy is not going to help.

Print This Post Print This Post

Annual gold-mine supply is just 1.5% of total gold supply

One of my readers sent me the following two-paragraph excerpt — written by someone called “Bill H” about a debate between Chris Powell and Doug Casey at a recent conference — from a commentary at lemetropolecafe.com, a web site dedicated to the idea that downward price manipulation dominates the gold market. He asked me to comment on the second paragraph, but I’ll do better than that — I’ll comment on both paragraphs. I’ll explain why the first paragraph contains a misunderstanding about economics and why the second paragraph reveals extreme ignorance of the gold market. First, here’s the excerpt:

Powell also pointed to Larry Summer’s Gibson paradox study where low gold prices also aid in low interest rates and allow for more debt and currency issuance than would otherwise be the case. He also pointed to documents from the CME that shed light on the fact the central banks are “customers” and actually receive volume discounts for trading. Chris then mentioned that just because gold has gone higher, this is not evidence of no suppression as gold would or could be much higher in price if it were not for suppression. In answer to Casey’s statement “we would never suppress the prices of gold and silver because this would aid the Chinese and Russians”, insider Jim Rickards claims a “deal” has been struck with the Chinese.

I have no proof of this one way or the other but it does make perfect sense to me. I could write an entire piece on this subject but for now a paragraph will have to suffice. If China (and India) are buying more than the entire year’s global production of gold …yet the price has been dropping during this operation …the metal HAS to be coming from somewhere. The ONLY “somewhere” this can be is from where it is (has) being stored, central bank vaults. The only possible way for prices to not rise when physical demand grossly exceeds supply is through the use of paper derivatives. It is really just this simple. In my opinion what Jim Rickards has said must have some truth behind it, some sort of deal has to have been struck which allows China/India (and Russia) to purchase increasing amounts of gold at decreasing prices. As I have said all along, once China cannot receive gold in exchange for dollars …then of what use are their dollar holdings? Do you see? The game will be up and there will be no incentive to China whatsoever to hold any dollars which will …end the game.

The misunderstanding about economics has three parts.

First, “Gibson’s Paradox” only applies in the context of a Gold Standard. It has no relevance to the current monetary system.

Second, there is actually no paradox.

As an aside, Keynesian economists sometimes arrive at what they consider to be paradoxes, the “Paradox of Thrift” being the classic case. However, this is only because they are being guided by hopelessly flawed economic theories. For example, Keynesians get the economic growth process completely backward. They think it begins with consumer spending, when in reality it ENDS with consumer spending and begins with saving. That’s why they believe that an economy-wide increase in saving (meaning: a reduction in consumer spending in the present) is bad for the economy and must be discouraged. In the case of “Gibson’s Paradox”, which revolves around the link between interest rates and the general price level under a Gold Standard, there will only be a paradox for the economist who doesn’t understand the relationship between interest rates and time preference (the desire to spend money in the present relative to the desire to delay spending (to save, that is)).

Third, if gold were being manipulated today in accordance with the relationship between gold and interest rates that existed during the Gold Standard, then an effort to create lower interest rates would involve an effort to manipulate the price of gold UPWARD relative to the prices of most other commodities (under the Gold Standard, a decline in interest rates tended to be associated with a rise in the purchasing power of gold). Strangely, this is what happened over the past 7 years, in that the gold/commodity (gold/CCI) ratio rose as interest rates fell and reached a multi-generational high in 2012 at around the same time as interest rates on long-dated US Treasury securities reached a multi-generational low.

Now, I’m not saying that gold was manipulated upward relative to other commodities as part of an attempt to suppress interest rates. These days central banks make full use of their power to manipulate interest rates directly, thus obliterating any reliable link between the price of credit and the general desire to spend/save. Central banks have even gone a long way towards obliterating any link between the price of credit and the risk of default. In a nutshell, interest rates have been distorted to the point where they no longer provide valid signals. What I’m saying is that you need to have a sub-par understanding of economics to believe that gold has been manipulated downward as part of a scheme to create lower interest rates.

I could write a lot more about the relationships between economy-wide time preference, interest rates, the general price level and gold, but I don’t want to get bogged down and this post is already longer than originally intended. Instead, let’s move on to the second of the excerpted paragraphs.

I was particularly impressed by the following sentences:

“If China (and India) are buying more than the entire year’s global production of gold …yet the price has been dropping during this operation …the metal HAS to be coming from somewhere. The ONLY “somewhere” this can be is from where it is (has) being stored, central bank vaults. The only possible way for prices to not rise when physical demand grossly exceeds supply is through the use of paper derivatives. It is really just this simple.”

These sentences reflect a very basic misunderstanding about the gold market that I end up addressing several times every year in TSI commentaries. The fact is that the supply of gold is NOT the annual amount of gold produced by the mining industry. Rather, the mining industry adds only about 1.5% to the total supply of gold every year. This is why changes in mine production have almost no effect on gold’s price trend and why it is illogical to compare the gold demand of some countries or regions with annual mine production.

The total supply of gold is around 170,000 tonnes, and over the next 12 months the mining industry will add about 2,500 tonnes to this total supply. Furthermore, the mining industry is no different to any other seller (an ounce of gold mined over the past year is the same as an ounce of gold that has been sitting in storage for the past 200 years), except that it is price-insensitive. The mining industry will sell its 2,500 tonnes regardless of price, whereas the actions of the holders of the existing 170,000 tonnes of aboveground gold will be influenced by changes in the gold price and changes in the perceived attractivess of gold as an investment or store of value.

Some existing holders (the weak hands) are likely sellers in response to price weakness, whereas other holders are likely sellers in response to price strength. Some existing holders will change their plans based on their assessments of current and likely future conditions, whereas others will be determined to hold forever. At the same time there are a huge number of potential buyers, some of whom will be planning to buy in response to lower prices, some of whom will be likely to buy in response to signs of an upward trend reversal, and many of whom will change their plans based on changes in the financial world.

The main point to be appreciated here is that it’s the urgency to sell on the parts of existing holders of the total gold stock relative to the urgency to buy on the parts of prospective new owners that determines the change in price. As noted above, the gold mining industry is just one small piece of a very big puzzle.

Finally, I’m not going to attempt to debunk the unsubstantiated claim that the US government has made a deal with the Chinese government whereby the gold price will be held down to facilitate the latter’s gold accumulation. This is just a nonsensical story.

Print This Post Print This Post

Does the monetary base drive the gold price?

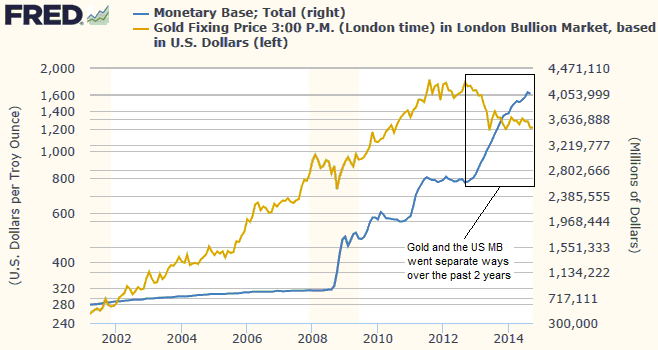
Two weeks ago I discussed the claim that the US debt/GDP ratio (the debt of the US federal government divided by US GDP) drove the gold price, with a rising debt/GDP ratio resulting in a higher gold price and a falling debt/GDP ratio resulting in a lower gold price. I explained that the claim was misleading, and that a chart purporting to demonstrate this relationship was both an example of data mining (in this case, cherry-picking a timescale over which the relationship worked while ignoring more relevant timescales over which it didn’t work) and an example of confusing correlation with causation. I also mentioned in passing that there was a similar misleading claim doing the rounds regarding the relationship between gold and the US monetary base (MB). Considering that the failure of the gold price to follow the US MB higher over the past two years is being cited by the usual suspects as evidence of gold-market manipulation, I’ll now briefly address the question: Does the US monetary base drive the gold price?

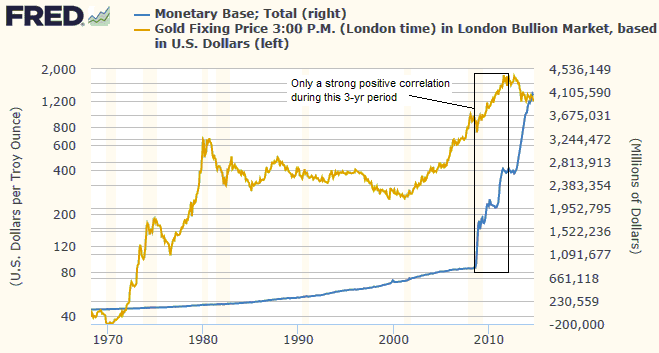
Those who believe that the answer to the question is “yes” will sometimes show a chart like the one presented below to prove the correctness of their belief. Clearly, if you were armed only with this chart and the conviction that a substantial rise in the US MB should always go hand-in-hand with a rallying gold price, then you would likely take the happenings of the past two years as definitive evidence of artificial gold-price suppression. Of course, you would also have to put aside the fact that the gold price rose 300% from its 2001 low to its early-2008 peak with only a minor increase in the US MB, but this wouldn’t be a problem because it is always easy to come up with a fundamental reason for a large rise in the gold price. It’s only a large price decline that needs to be explained-away by a manipulation theory.

So, is gold’s divergence over the past two years from the on-going rise in the US MB strange or suspicious, such that it can be best explained by market manipulation?

The answer is no. As is the case with the relationship between the gold price and the debt/GDP ratio, the visually-appealing positive correlation of the past several years disappears when the gold-MB relationship is viewed over a much longer timescale. Specifically, the following chart shows that the only period over the past 45 years during which there was a strong positive correlation between the gold price and the monetary base was the three-year period from late-2008 through to late-2011.

I wish that anticipating the performance of the US$ gold price were as easy as monitoring the US monetary base or the Fed’s balance sheet (the monetary base is controlled by the Fed via the expansion/contraction of its balance sheet), but unfortunately the gold market isn’t that simple. The reality is that like a rising debt/GDP ratio, a sharply rising monetary base can be a valid part of a bullish gold story. However, this is only to the extent that it helps to bring about lower real interest rates and/or a steeper yield curve and/or a weaker US dollar and/or rising credit spreads. It isn’t directly bullish.

I think that the first leg of the next substantial multi-year rally in the gold price will be linked to the Fed’s efforts to stabilise or contract the monetary base, because these efforts will expose the mal-investments of the past few years.

Print This Post Print This Post

Does the debt/GDP ratio drive the gold price?

The article linked HERE answers yes to the above question. The correct answer is no.

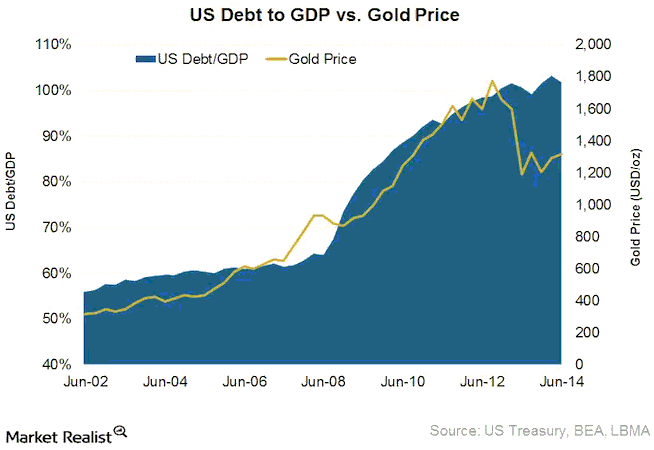
The above-linked article presents the following graph as evidence that the debt/GDP ratio (US federal government debt divided by US GDP, in this case) does, indeed, drive the US$ gold price. However, this is a classic example of cherry-picking the timescale of the data to demonstrate a relationship that isn’t apparent over other timescales. It is also a classic example of confusing correlation with causation. Many things went up in price during the 2002-2014 period covered by this graph. Should we assume that all of these price rises were caused by the increase in the US government-debt/GDP ratio?

By the way, graphs like this were far more visually appealing — although no more valid — three years ago, because the positive correlation ended in 2011. Since 2011, the debt/GDP ratio has continued its relentless advance while the gold price has trended downward. A similar graph that was popular for a while showed a strong positive correlation between the gold price and the US monetary base from the early-2000s through to 2011-2012, which created the impression that the gold price would continue to rise as long as the US monetary base continued to do the same. Again, though, this impression was the result of confusing correlation and causation.

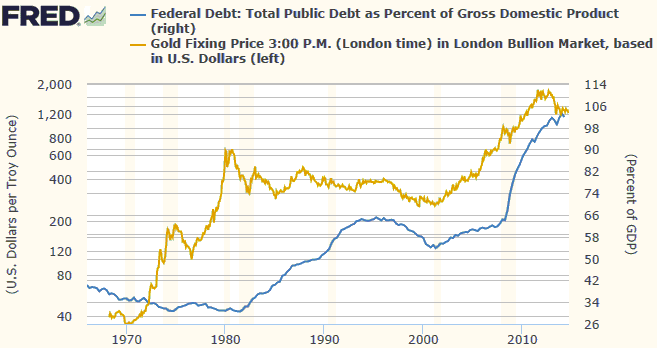
Here’s a chart showing the relationship between the gold price and the US debt/GDP ratio over a much longer period. This chart’s message is that there is no consistent relationship between these two quantities. For example, the huge gold bull market of the 1970s occurred while the debt/GDP ratio was low with a slight downward bias and actually ended at around the time that the debt/GDP ratio embarked on a major upward trend. In fact, from the early-1970s through to the mid-1990s there appeared to be an INVERSE relationship between the gold price and the debt/GDP ratio, but this is just a coincidence. It doesn’t imply that gold was hurt by a rising debt/GDP ratio and helped by a falling debt/GDP ratio; it implies that the debt/GDP ratio isn’t a primary driver of gold’s price tend. For another example, the gold price and the debt/GDP ratio rose in parallel during 2001-2006, but the rise in the debt/GDP ratio during this period was slow and was not generally considered to be a reason for concern. Therefore, it wasn’t the driver of gold’s upward trend.

The theory that the US government debt/GDP ratio is an important driver of the US$ gold price seems to be solely based on the 3-year period from late-2008 through to late-2011, when the two rocketed upward together.

The reality is that a rising US debt/GDP ratio can be a valid part of a bullish gold story, but only to the extent that it helps to bring about lower real interest rates and/or a steeper yield curve and/or a weaker US dollar and/or rising credit spreads. It isn’t directly bullish for gold, which is why a long-term comparison of the US$ gold price and the US debt/GDP ratio shows no consistent relationship. The same can be said about a rising US monetary base.

Print This Post Print This Post

Lower US living standards are an INTENDED consequence of Fed policy

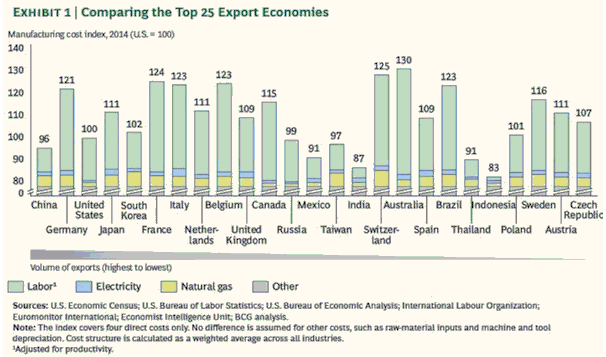
The following chart is very interesting. I found it in John Mauldin’s latest “Thoughts from the Frontline” letter, although it was created by the Boston Consulting Group. It compares the cost of manufacturing in the top 25 exporting countries.

mfg_cost_170914

According to this chart, Australia is now the most expensive country to manufacture stuff. Manufacturing costs in Australia are now 30% higher than in the US, almost 20% higher than in Japan, almost 10% higher than in Germany, and about 5% higher than in Switzerland. The cost of manufacturing in the US is now slightly below the average — at around the same level as South Korea, Russia, Taiwan and Poland. This means that the Fed is almost half way to its goal of reducing US living standards to the point where the average factory worker in the US can compete on a cost basis with the average factory worker in Indonesia.

The above comment is only partly tongue-in-cheek. Many pro-free-market commentators discuss the decline in US living standards as if it were an unintended consequence of the Fed’s policies, but there is nothing unintended about it. It is a deliberate objective. The Fed will never come out and say “we are doing what we can to reduce living standards”, but a policy that is designed to boost asset prices, support capital-consuming businesses and promote investments that would never see the light of day in the absence of artificially low interest rates, all while minimising “wage inflation”, is also designed to reduce real wages and, therefore, to reduce living standards. The Fed surely doesn’t want to reduce US living standards to Indonesian levels, but that’s the direction in which its efforts are deliberately pointed.

I’ve explained in TSI commentaries that the root of the problem is unswerving commitment to bad economic theory. Under the Keynesian theories that all central bankers religiously follow, wealth is something that just exists. There is no careful and deep consideration given to how the wealth came to be and why some countries managed to accumulate a lot of wealth while other countries remained poor. According to these theories, people spend more during some periods due to a vague notion called rising “animal spirits”. This causes the amount of wealth to grow. Then, after a while, the mysterious “animal spirits” begin to subside, causing people to start spending less. This leads to a reduction in the amount of wealth. Under this perception of the world, one of the central bank’s primary tasks is to combat the unfathomable and destabilising natural force that drives the shifts in spending. This is done by indirectly manipulating prices throughout the economy, including the real price of labour.

The so-called counter-cyclical policies are destined to backfire, but the nature of the eventual backfiring is often difficult to predict. In broad terms, there are two possibilities: There could be a surge in inflation fear followed by a collapse in asset prices, a recession and a moonshot in deflation fear, or the collapse in asset prices and its knock-on effects could happen without a preceding surge in inflation fear. In both cases, the asset-price collapse and recession would likely usher-in a new round of ‘stimulative’ policy, because the devotion to bad theory prevents the right lessons from being learned.

Print This Post Print This Post

T-Bonds are still defying almost everyone’s expectations

One of the main reasons that T-Bonds continue to rise in price (fall in yield) is that most speculators continue to bet on a price decline (a rise in long-term interest rates). In other words, the sentiment backdrop remains supportive. It’s worth noting, for example, that despite the strong and consistent upward trend of the past 9 months, there is still a substantial speculative net-short position across the 30-year T-Bond and 10-year T-Note futures markets. Therefore, higher T-Bond/T-Note prices and lower long-term interest rates probably lie in store.

That being said, the iShares 20+ Year Treasury ETF (TLT) is now a) very ‘overbought’ by some measures (momentum, not sentiment), b) within 2% of intermediate-term resistance at 120, and c) within 6% of its mid-2012 all-time high. A test of resistance at 120 will almost surely happen and a test of the all-time high will possibly happen prior to the next intermediate-term peak, but a sustained break into all-time-high territory is very unlikely.

TSI was short-term bullish on US Treasury bonds from mid-December of last year through to mid-August of this year, but turned short-term “neutral” in a report published on 17th August. I expect to see additional gains in the T-Bond price and additional declines in the T-Bond yield over the next few months, but the short-term risk/reward is no longer skewed towards reward. It is also not skewed towards risk, meaning that it doesn’t yet make sense to bet against this market.

Print This Post Print This Post

The coming mother-of-all economic busts

The extent to which monetary stimulus weakens an economy’s foundations and gets in the way of real progress will be proportional to the aggressiveness of the stimulus. This is because the greater the monetary stimulus, the greater the part within the overall economy that will end up being played by ‘bubble activities’ (businesses, projects, investments and speculations that only seem viable due to artificially low interest rates and a constant, fast-flowing stream of new money). That’s why the unprecedented (at that time) monetary stimulus of 2001-2005 led to the most severe economic fallout in more than 50 years, and why the even more over-the-top monetary stimulus of 2008-2013 has paved the way for an economic downturn of even greater severity than that of 2007-2009.

I’ll be writing more about the coming economic bust (aka severe recession or depression) over the next several months, especially if signs appear that it will soon get underway. For now, here are a few preliminary thoughts:

1) The next economic bust is likely to be worse than, and different from, the one that occurred during 2007-2009. What I mean is that the next bust is unlikely to be an amplified version of what happened previously. The main reason is that almost everyone, including the monetary central planners, will be prepared for a repeat of 2007-2009. Of particular relevance, whereas the Fed didn’t start to pump money into the economy until almost 12 months after the start of the 2007-2009 financial crisis and economic recession (the Fed began to cut its targeted interest rate in September of 2007, but it didn’t begin to monetise assets in a way that boosted the monetary inflation rate until September of 2008), it’s likely that the next time around the Fed will be much quicker to ramp up the money supply.

2) Due to the much quicker application of monetary ‘accommodation’ to counteract future economic weakness, the next bust could be associated with sharply rising commodity prices. This would be due to commodity hoarding in reaction to the belief that money is being trashed.

3) In the lead-up to and during the next economic bust, gold will probably be the best investment because it is the most logical commodity for large investors to hoard. It is the most logical commodity-refuge due to its global liquidity, its globally recognised value, the fact that the amount of gold used in commercial/industrial applications is trivial compared to the amount of gold held for monetary/investment/speculative purposes, and the distinct possibility that a collapse of or an existential threat to the current monetary system would result in gold returning to its traditional role as money.

4) The next economic bust won’t be caused by a geopolitical event, such as the disintegration of Ukraine and/or Iraq, but it will likely be exacerbated by restrictions placed on international trade due to increasing geopolitical tension.

5) The timing of the next bust is currently unknown. Two years ago I thought that it would be well underway by now, but it’s clear that negative real interest rates have a remarkable ability to postpone the day of reckoning. My current guess is that it will begin in 2015.

6) Three things I expect to see shortly before the start of the next economic bust are: a) the S&P500 Index dropping well below its 200-day moving average; b) evidence across the financial markets of a general increase in risk aversion (e.g. widening credit spreads, strength in gold relative to most other commodities); and c) a decline in the US monetary inflation rate to below 7%.

Print This Post Print This Post