Helicopter Money

Print This Post Print This Post

Helicopter Money

Here is an excerpt from a recent TSI commentary about another absurd course of action now being seriously considered by the monetary maestros.

Once upon a time, the concept of “helicopter money” was something of a joke. It was part of a parable written by Milton Friedman to make a point about how a community would react to a sudden, one-off increase in the money supply. Now, however, “helicopter money” has become a serious policy consideration. So, what exactly is it, how would it affect the economy and what are its chances of actually being implemented?

“Helicopter money” is really just Quantitative Easing (QE) by another name. QE hasn’t done what central bankers expected it to do, so the idea that is now taking root is to do more of it but call it something else. Apparently, calling it something else might help it to work (yes, the people at the upper echelons of central banks really are that stupid). The alternative would be to question the models and theories upon which QE is based, but such questioning of underlying principles must never be done under any circumstances. A Keynesian economist calling into question the principle that an economy can be made stronger via methods that artificially stimulate “aggregate demand” would be akin to the Pope questioning the existence of god.

The only difference between QE as practiced by the Fed and “helicopter money” is the path via which the new money gets injected. Under the Fed’s previous QE programs, new money was created via the monetisation of debt and ended up in the accounts of securities dealers*. Under a “helicopter money” program, new money would still be created via the monetisation of debt. However, in this case the new money would be placed by the government into the accounts of the general public, via, for example, tax cuts and welfare payments (handouts), and/or placed by the government into the accounts of contractors working for the government.

If promoted in the right way, “helicopter money” could have widespread appeal among the general public. Unlike the Fed’s traditional QE, which had the superficial effect of making the infamous top-1% richer and the majority of the population poorer, the average member of the voting public could perceive an advantage for himself/herself in “helicopter money”. Unfortunately, regardless of who gets the new money first there is no way that an economy can be anything other than weakened by the creation of money out of nothing. The reason is that the new money falsifies the price signals upon which economic decisions are made, leading to ill-conceived investments and other spending errors.

Due to the distortions of price signals that they bring about, both traditional QE and “helicopter money” are bad for the economy. However, an argument could be made that “helicopter money” is the lesser of the two evils. The reason is that with “helicopter money” the effects of the monetary inflation will more quickly become apparent in everyday expenses and the popular price indices. That is, “helicopter money” will quickly lead to inflationary effects that are obvious to everyone. This limits the extent to which the policy can be implemented.

Putting it another way, traditional QE had by far its biggest effects on the prices of things that, according to the average economist, central banker and politician, don’t count when assessing “inflation”, whereas the effects of “helicopter money” would soon become obvious in the prices of things that do count. A consequence is that a “helicopter money” program would be reined-in relatively quickly and the long-term damage to the economy would be mitigated.

With regard to the chances of “helicopter money” actually being implemented, we think the chances are very good in Japan, very poor in the euro-zone (due to there being a single central bank ‘serving’ a politically-disparate group of countries) and somewhere in between in the US.

Although it presently seems like the more extreme policy, the US has a better chance of experiencing “helicopter money” than negative interest rates within the next two years. This is because a) the next US president will be an economically-illiterate populist (regardless of who wins in November), b) the average voter will likely perceive a financial advantage from “helicopter money”, and c) hardly anyone outside the halls of Keynesian academia will perceive anything other than a disadvantage from the imposition of negative interest rates.

In summary, then, “helicopter money” is QE by a different name and path. It would inevitably reduce the rate of economic progress, but it has a reasonable chance of being implemented in the US the next time that policy-makers are desperate to do something.

*Every dollar of Fed QE adds one dollar to the commercial bank account of a Primary Dealer (PD) and one dollar to the reserve account at the Fed of the PD’s bank, meaning that every dollar of QE adds one reserve-covered dollar to the economy-wide money supply.


Print This Post Print This Post

Are central banks out of bullets?

In a recent letter John Mauldin worries that central banks are ‘out of bullets’, but this is not something that any rational person should be worried about. Instead, they should be worried about the opposite.

The conventional view is that with interest rates at all-time lows and with vast amounts of debt having already been monetised, if a recession were to occur in the not-too-distant future there would be nothing that the central banks could do to ameliorate it. However, this view is based on the false premise that central banks can smooth-out the business cycle by easing monetary policy at the appropriate time. The truth is that by distorting interest rates, central banks get in the way of economic progress and cause recessions to be more severe than would otherwise be the case.

Think of it this way: If it is really possible for a committee of bureacrats and bankers to create a better outcome for the economy by setting interest rates (the price of credit), then it logically follows that a healthier economy would result from having all prices set by committees comprised of relevant ‘experts’. There should be an egg committee to set the price of eggs, a car committee to set the price of cars, a massage committee to set the price of massages, etc. After all, if it really is possible for a committee to do a better job than a free market at determining the most complicated of prices then it is certainly possible for a committee to do a better job than a free market at setting any other price.

However, hardly anyone believes that all prices should be set by committee or some other governing body. This is undoubtedly because that type of price control proved to be an unmitigated disaster wherever/whenever it was tried throughout history. Most people therefore now realise that it would make no sense to have committees in place to control prices in general, but are strangely incapable of making the small logical step to the realisation that it makes no sense to give a committee the power to control the most important price in the economy — the price of something that influences the price of almost everything else.

Getting back to the worry that central banks are out of bullets, it would actually be good news if they were. This is because a central bank does damage to the economy every time it fires one of its so-called monetary bullets. The damage usually won’t be apparent to the practitioners of the superficial, ad-hoc economics known as Keynesianism, but it will inevitably occur due to the falsification of price signals.

Unfortunately, central banks have an unlimited supply of bullets. This has been demonstrated over recent years by zero not proving to be a lower boundary for the official interest rate and by asset monetisation proving to be not restricted to government bonds. We should therefore expect central banks to keep firing until they are reined-in by market or political forces.

The real worry, then, isn’t that central banks are out (or almost out) of bullets. The real worry is that they are not remotely close to being out of bullets.

Print This Post Print This Post
Central bankers believe that they can provide free lunches

[This post is a modified excerpt from a recent TSI commentary.]

A lot of good economic theory boils down to the acronym TANSTAAFL, which stands for “There Ain’t No Such Thing As A Free Lunch”. TANSTAAFL is an unavoidable law of economics, because everything must be paid for one way or another. Furthermore, attempts by policymakers to get around this law invariably result in a higher overall cost to the economy. Unfortunately, central bankers either don’t know about TANSTAAFL or are naive enough to believe that their manipulations can provide something for nothing. They seem to believe that the appropriate acronym is CBCCFLAW, which stands for “Central Banks Can Create Free Lunches At Will”.

ECB chief Mario Draghi is the leader in applying policies based on CBCCFLAW. Despite his economic stimulation measures having a record to date that is unblemished by success, he recently launched new attempts to conjure-up a free lunch.

I’m referring to two measures that were announced in March and have just started to be implemented, the first of which is the ECB’s corporate bond-buying program (starting this month the ECB will be monetising investment-grade corporate bonds in addition to government bonds). This program is designed to bring about a further reduction in interest rates, because, as we all know, if there’s one thing that’s holding Europe back it’s excessively high interest rates, where “excessively high” means above zero.

Unlike the situation in the US, very little corporate borrowing in Europe is done via the bond market. The ECB’s new corporate bond-buying program is therefore unlikely to provide even a short-term boost, but, not to worry, that’s where the ECB’s second measure comes into play.

The ECB’s second measure is a new round of a previously-tried program called the Targeted Long Term Refinancing Operation (TLTRO). Under the TLTRO program, commercial banks get encouraged — via a near-zero or negative interest rate — to borrow money from the ECB on the condition that the banks use the money to make new loans to the private sector.

The combination of the ECB’s two new measures is supposed to promote credit expansion and higher “inflation”. In other words, to the extent that the measures are successful they will result in more debt and a higher cost of living. In Draghi’s mind, this would be a positive outcome.

In the bizarre world occupied by the likes of Draghi, Yellen and Kuroda, the failure of an economy to strengthen in response to a policy designed to stimulate growth never, ever, means that the policy was wrong. It always means that not enough was done. It’s not so much that these central planners refuse to see the flaws in their policies, it’s that they cannot possibly see. They cannot possibly see because they are looking at the world through a Keynesian lens. Trying to understand how the economy works using Keynesian theory is like trying to understand the movements of the planets using the theory that everything revolves around the Earth.

So, the worse things get in response to counter-productive ‘economic stimulation’ policies, the more aggressively the same sorts of policies will be applied and the worse things will eventually get. This is what I’ve referred to as the Keynesian death spiral.

Print This Post Print This Post
Gold and the Keynesian Death Spiral

Almost anything can be a good investment or a bad investment — it all depends on the price. Relative to the prices of other commodities the gold price is high by historical standards and in dollar terms gold is nowhere near as cheap today as it was 15 years ago, but considering the economic backdrop it offers reasonable value in the $1200s. Furthermore, considering the policies that are being implemented and the general lack of understanding on display in the world of policy-making, there’s a good chance that gold will be much more expensive in two years’ time.

The policies to which I am referring are the money-pumping, the interest-rate suppression and the increases in government spending that happen whenever the economy and/or stock market show signs of weakness. These so-called remedies are actually undermining the economy, so whenever they are applied in response to economic weakness they ultimately result in more weakness. It’s not a fluke, for example, that the most sluggish post-recession economic recovery of the past 60 years went hand-in-hand with history’s most aggressive demand-boosting intervention by central banks and governments.

It’s a vicious cycle that can aptly be called the ‘Keynesian death spiral’. The Keynesian models being used by policy-makers throughout the world are based on the assumption that when interest rates are artificially lowered and new money is created and government spending is ramped up, the economy gets stronger. The models are completely wrong, because falsifying price signals leads to investing errors and therefore hurts, not helps, the overall economy, and because the government doesn’t have a spare pile of wealth that it can put to work to create real growth (everything the government spends must first be extracted from the private sector). However, the models are never questioned.

When a sustained period of economic growth fails to materialise following the application of the demand-boosting remedies, the conclusion is always that the remedies were not applied with sufficient vigor. More of the same is hence deemed necessary, because that’s what the models indicate. It’s akin to someone with liver damage caused by drinking too much alcohol being guided by a book that recommends addressing the problem by increasing alcohol consumption. A new dose of alcohol will initially make the patient feel better at the same time as it adds to the existing damage, just as a new dose of demand-boosting intervention will initially make the economy seem stronger at the same time as it gets in the way of genuine progress.

The upshot is that although gold is more expensive today than it was 15 years ago, the level at which gold offers good value is considerably higher today than it was back then because we are now much further along the Keynesian death spiral.

Print This Post Print This Post

TANSTAAFL and the present-future tradeoff

When the central bank lowers interest rates in an effort to prompt greater current spending it brings about a wealth transfer from savers to speculators of various stripes. While this is unethical, in economics terms the ethical problem isn’t the main issue. The main issue, and the reason that monetary stimulus doesn’t work as advertised, is TANSTAAFL (There Ain’t No Such Thing As A Free Lunch). At a very superficial level (the level at which all Keynesian economists operate) the interest-rate suppression policies appear to provide a free, or at least a very cheap, lunch, but the bill ends up being much higher than it would have been if it had been paid up front.

The likes of Bernanke, Yellen, Draghi and Kuroda admit that their so-called “monetary accommodation” hurts savers in the present, but they claim that the benefits to the overall economy outweigh the disadvantages to savers. Central bankers are apparently — at least in their own minds — endowed with a god-like wisdom that enables and entitles them to determine who should become poorer and who should become richer, all with the aim of elevating the economy. For example, here’s how the ECB justified its interest-rate suppression policy in June of 2014:

The ECB’s interest rate decisions will…benefit savers in the end because they support growth and thus create a climate in which interest rates can gradually return to higher levels.

And:

A central bank’s core business is making it more or less attractive for households and businesses to save or borrow, but this is not done in the spirit of punishment or reward. By reducing interest rates and thus making it less attractive for people to save and more attractive to borrow, the central bank encourages people to spend money or invest. If, on the other hand, a central bank increases interest rates, the incentive shifts towards more saving and less spending in the aggregate, which can help cool an economy suffering from high inflation. This behaviour is not specific to the ECB; it applies to all central banks.

It’s now two years later and the ECB is heading down the same policy path despite the complete absence of any success. The benefit that savers are supposedly going to get “in the end” appears to be even further away now than it was back then, although it is fair to say that European savers have definitely got it ‘in the end’.

Only the final sentence of the above excerpt is true (it’s true that the ECB is just as bad as other central banks). In order to believe the rest, you must have a poor understanding of economic theory.

‘Time’ is the most important element that central bankers deliberately or accidentally ignore when they make the sort of statements included in the above ECB quote. Increased saving does not mean reduced spending; it means reduced spending on consumer goods in the present in exchange for greater spending on consumer goods in the future. By the same token, reduced saving does not mean increased spending; it means increased consumer spending in the present in exchange for reduced consumer spending in the future.

Isn’t it obvious that this tradeoff between current and future consumer spending will happen most efficiently and for the greatest benefit to the overall economy if it is allowed to happen naturally, that is, if interest rates are allowed to reflect peoples’ actual time preferences? To put it another way, isn’t it obvious that if people are in a financial position where it makes sense for them to increase their saving (reduce their current spending on consumer goods) in order to repair balance sheets that have been severely weakened by excessive prior consumer spending, then the WORST thing that a policymaker could do is put obstacles in the way of saving and create artificial incentives for additional borrowing and consumption?

It obviously isn’t obvious, because monetary policymakers around the world continue to do the worst things they could do.

Print This Post Print This Post
Consequences of a Trump Presidency

Now that Donald Trump has managed — against the odds and much to the chagrin of ‘war party’ loyalists — to become the Republican Party’s nominee in the Presidential election to be held in November, it is worth considering what a Trump presidency would mean. Here are some preliminary thoughts.

First, I expect that with the Primary campaign out of the way Trump will start to downplay some of the most hare-brained ideas he has spouted to date, such as building a giant wall along the US-Mexico border and banning all Muslims from entering the US. It’s unlikely that these wildly foolish ideas will ever be turned into actual policies, and in any case even if President Trump tried to implement them it’s unlikely that he would obtain the required parliamentary approval.

Second, I doubt that President Trump would go ahead with his threat to implement hefty tariffs on imports from China, because I don’t think he is stupid enough to believe that imposing such restrictions on international trade could possibly benefit the US economy. My guess is that when he uttered the protectionist nonsense he was pandering to voters who are struggling economically and willing to believe that their problems could be quickly fixed by someone capable of doing smart trade deals with other world leaders. But if I am over-estimating his acumen and he genuinely believes what he is saying on this matter, then President Trump would effectively be pushing for similar trade barriers to the ones that helped make the Great Depression greater than it would otherwise have been.

As an aside, just because someone relentlessly promotes himself as a great deal-maker, doesn’t mean he actually is. Also, the problems facing the US have almost nothing to do with poor deal-making in the past and could not be solved by good deal-making in the future.

Third, I doubt that the result of the November Presidential election will have a big effect on the US economy. The way things are shaping up, whoever gets elected this November will end up presiding over a sluggish economy at best and a severe recession at worst. This is baked into the cake due to what the Fed and the government have already done.

Furthermore, both Trump and Clinton appear to be completely clueless regarding the causes of the economic problems facing the US, which means that economically-constructive policy changes are unlikely over the years immediately ahead irrespective of the election result. For example, Trump has expressed a liking for currency depreciation and artificially-low interest rates, which means that he is a supporter of the Fed’s current course of action even though he would prefer to have a Fed Chief who called himself/herself a Republican. Trump has also said that he would leave the major entitlement programs alone, even though these programs encompass tens of trillions of dollars of unfunded liabilities.

Fourth, it currently isn’t clear that any major financial market will have an advantage or disadvantage depending on who is victorious in November. For example, regardless of who wins in November it’s likely that evidence of an inflation problem will be more obvious during 2017-2018 than it is today, resulting in higher bond yields (lower bond prices). For another example, how the stock market performs from 2017 onward will depend to a larger extent on what happens over the next 6 months than on the election result. In particular, a decline in the S&P500 to below 1600 this year could set the stage for a strong stock market thereafter. For a third example, gold is probably going to be a good investment over the next few years due to the combination of declining real interest rates, rising inflation expectations and problems in the banking industry. This will be the case whether the President’s name is Trump or Clinton.

Fifth, based on what has been said by the two candidates and on Hillary Clinton’s actions during her long stretch as a Washington insider, every advocate of peace should be hoping for a Trump victory in November. The reason is that a vote for Clinton is a vote for the foreign-policy status quo, which means a vote for more humanitarian disasters and strategic blunders along the lines of the Iraq War, the destruction of Libya, the aggressive deployment of predator drones that kill far more innocent people than people who pose a genuine threat, the intervention in Ukraine that needlessly and recklessly brought the US into conflict with Russia, the inadvertent creation and arming of ISIS, and the haphazard bombing of Syria. Based on what he has said on the campaign trail, a vote for Trump would be a vote for foreign policy that was less concerned about regime change, less eager to intervene militarily in the affairs of other countries, and generally less offensive (in both meanings of the word).

Summing up, a Trump presidency would probably be a significant plus in the area of foreign policy (considering the alternative), but there isn’t a good reason to expect that the US economy and financial markets would fare any better or worse under Trump than they would under Clinton. At least, there isn’t a good reason yet.

Print This Post Print This Post
What happened to the “global US$ short position”?

At this time last year there was a lot of talk in the financial press about the huge US$ short position that was associated with the dollar-denominated debts racked up over many years in emerging-market countries. This debt-related short position supposedly guaranteed additional large gains for the Dollar Index over the ensuing 12 months. But now, with the Dollar Index having drifted sideways for 12 months and having had a downward bias for the past 5 months it is difficult to find any mention of the problematic US$ short position. Did the problem magically disappear? Did the problem never exist in the first place?

Fans of the US$ short position argument needn’t fret, because the argument will certainly make a comeback if the Dollar Index eventually breaks above the top of its drawn-out horizontal trading range. It will make a comeback regardless of whether or not it is valid, because it will have a ring of plausibility as long as the Dollar Index is rising.

I’m not saying that the argument for a stronger US$ driven by the foreign-debt-related US$ short position is invalid. I’m not saying it yet, anyway. The point I’m trying to make above is that if the argument was correct a year ago then it is just as correct today (since debt levels haven’t fallen) and should therefore be just as popular today. It is nowhere near as popular, though, because most fundamentals-based analysis is concocted to match the price action.

I actually view the “global US$ short position” as more of an effect than a cause of exchange-rate trends. Major currency-market trends are caused by differences in stock-market performance, real interest rates and monetary inflation rates. When these factors conspire to create a downward trend in the US dollar’s foreign exchange value it becomes increasingly attractive for people outside the US to borrow dollars. And when these factors subsequently conspire to create an upward trend in the US dollar’s foreign exchange value, debt repayment becomes more costly for anyone with US$-denominated debt outside the US.

So, if the Dollar Index resumes its upward trend later this year then anyone outside the US with hefty US$-denominated debt will have a problem, but the deteriorating collective financial position of these foreign US$ borrowers won’t be the cause of the dollar’s strength. It will just be a popular justification for the strength.

In general, fundamentals-based analysis will look correct and achieve popularity if it matches the price action, even if it is complete nonsense. A related point is that if fundamentals-based analysis is contrary to the recent price action then hardly anyone will believe it, irrespective of the supporting facts and logic.

Print This Post Print This Post
Brazil Boom and Bust

Brazil, the ‘B’ in the BRIC acronym, was widely considered to be a model of emerging-market economic excellence during 2003-2011. Now it is widely considered to be an economic basket-case. What went wrong?

There are always many factors involved in a major economic turnaround, but for Brazil’s economy — and for many other economies over the past 15 years — the most important point to understand is that the impressive growth was not genuine; it was an artifact of rapid monetary inflation. Brazil’s government was just as corrupt and interventionist as ever during the period of impressive growth, but for a long time nobody noticed (or cared) because rapid domestic monetary inflation in parallel with a commodity bull market driven by rapid global monetary inflation created the illusion of increasing prosperity.

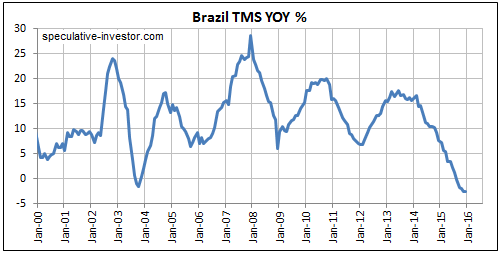
Brazil no longer has a monetary inflation problem. In fact, as depicted in the True Money Supply (TMS) chart below, it is now experiencing monetary DEFLATION.

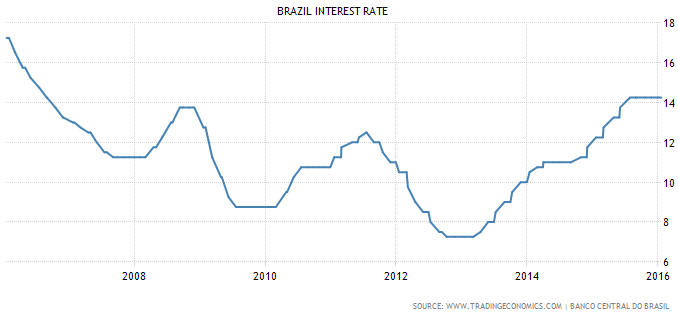
And yet, Brazil’s central bank is still ‘tightening the monetary screws’. As illustrated by the following chart, it moved its targeted interest rate to an 8-year high of 14.25% in mid-2015 and has kept it there.

Brazil_intrate_020316

The current situation in Brazil underlines the problem of having monetary central planners. Even the smartest and most incorruptible of central planners will make the economy less efficient, because the right level for a price is the price that would exist in the absence of government or central-bank interference. However, monetary central planners tend to make matters even worse by reacting to backward-looking economic data and to the lagged effects of earlier policies.

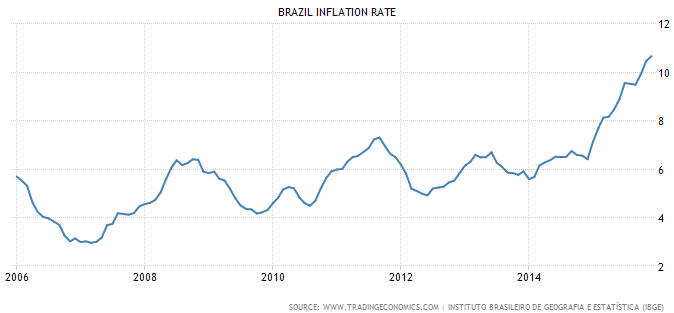
In Brazil’s case, rather than acknowledging the extreme current tightness of monetary conditions and acting accordingly, the central bank is fixating on the CPI, which is, in turn, accelerating upward due to the lagged effects of the monetary inflation that happened years ago. This is a good example of how central bankers not only fail in their self-proclaimed mission to smooth-out the business cycle, but also greatly amplify the economic oscillations.

Brazil’s experience over the past 10 years is another in a long line of real-world demonstrations of Austrian Business Cycle Theory. Rapid monetary inflation and the lowering of interest rates results in an artificial boom, during which the GDP numbers look good at the same time as wealth-destroying investing mistakes are being made on a grand scale. The boom sets the stage for a bust, which wipes out all of the preceding gains and then some.

Print This Post Print This Post
Can a US recession occur without an inverted yield curve?

This blog post is a modified excerpt from a recent TSI newsletter.

One of the bullish arguments on the US economy and stock market involves pointing out that a) the yield curve hasn’t yet signaled a recession, and b) the historical record indicates that recessions don’t happen until after the yield curve gives a warning signal. This line of argument arrives at the right conclusion for the wrong reasons.

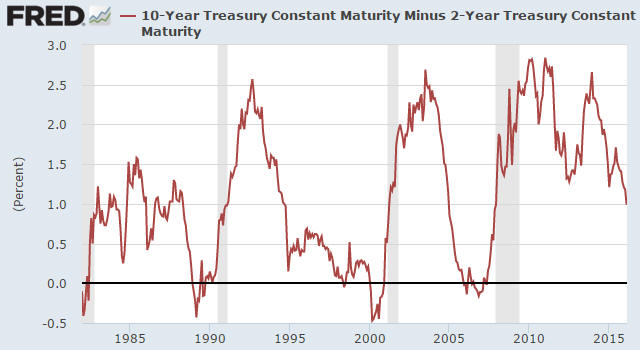
The bullish argument being made is that every recession of the past umpteen decades has been preceded by an inverted yield curve (indicated by the 10-year T-Note yield dropping below the 2-year T-Note yield). The following chart shows that while the yield curve has ‘flattened’ (the 10yr-2yr spread has decreased) to a significant degree it is still a long way from becoming inverted (the yield spread is still well above zero), which supposedly implies that the US economy is not yet close to entering a recession.

The problem with the argument outlined above is that it doesn’t take into account the unprecedented monetary backdrop. In particular, it doesn’t take into account that as long as the Fed keeps a giant foot on short-term interest rates it will be virtually impossible for the yield curve to invert. It should be obvious — although to many pundits it apparently isn’t — that the Fed can’t hold off a recession indefinitely by distorting the economy’s most important price signal (the price of credit), that is, by taking actions that undermine the economy.

The logic underpinning the bullish argument is therefore wrong, but it’s still correct to say that the yield curve hasn’t yet signaled a recession. The reason is that an inversion of the yield curve has NEVER been a recession signal; the genuine recession signal has always been the reversal in the curve from ‘flattening’ (long-term interest rates falling relative to short-term interest rates) to ‘steepening’ (long-term interest rates rising relative to short-term interest rates) after an extreme is reached. It just so happens that under more normal monetary conditions, an extreme isn’t reached and the reversal therefore doesn’t occur until after the yield curve becomes inverted.

This time around the reversal will almost certainly happen well before the yield curve becomes inverted, but it hasn’t happened yet.

Print This Post Print This Post

The original Fed versus today’s Fed

In a recent blog post, Martin Armstrong wrote: “This constant attack on central banks is really hiding what the problem truly is — government. When the Fed was created, it “stimulated” the economy by purchasing corporate paper. The Fed was NEVER intended to buy government bonds. The politicians did that for World War I and never returned it to its purpose.” That’s not entirely true. Also, it’s naive to believe that the Fed would benefit the overall economy if it were restricted to its originally-intended purpose.

Contrary to Mr. Armstrong’s assertion, the Federal Reserve Act of 1913 actually does enable the Fed to buy government paper. Specifically, Section 14 of the Act states:

Every Federal reserve bank shall have power … [to] buy and sell, at home or abroad, bonds and notes of the United States, and bills, notes, revenue bonds, and warrants with a maturity from date of purchase of not exceeding six months, issued in anticipation of the collection of taxes or in anticipation of the receipt of assured revenues by any State, county, district, political subdivision, or municipality…

More generally, the Federal Reserve Act gave Federal Reserve banks the power to purchase short-term commercial paper (bills of exchange) and short-term government paper, and to set the discount rates associated with these purchases.

Secondly, the whole concept of economic stimulation by central banks in general and the Fed in particular is one of world history’s greatest-ever cases of mission creep. A central bank cannot possibly stimulate an economy by lowering interest rates and creating money; all it can do is distort an economy and exacerbate the boom-bust cycle. Although the theoretical framework had not yet been fully developed by the likes of Ludwig von Mises, this was generally known by economists at the time of the Fed’s establishment in 1913 and explains why there was no mention in the Federal Reserve Act of the Fed taking actions in an effort to modulate the pace of economic growth. Unfortunately, economics is the one science that has taken a giant step backwards over the past 100 years. Whereas there was originally no intention of having the Fed interfere with market rates of interest and react in a counter-cyclical manner to shifts in economic activity, most economists can no longer even envisage an economy that is free from central-bank manipulation.

Thirdly, while it would be a great improvement if the Fed were limited by the rules that originally governed its actions, it is important to understand that the problems (the periodic bank runs and financial crises) that the Fed was set up to address are the result of fractional reserve banking. Rather than eliminate fractional reserve banking, which would have been the correct solution, a central bank was established as a work-around. This is mainly because some of the most powerful and influential people in the country were bankers. Not surprisingly, most bankers like having the legal power to create money out of nothing.

My final point is that the Federal Reserve Act of 1913 was a foot in the economic door. Once the foot was in the door it was always going to be just a matter of time before the entire body had wormed its way in. The reason is that the powers of central banks grow in the same way as the powers of governments, with each intervention leading to problems that create the justifications for more interventions and with the occasional crisis providing the justification for a quantum leap in power. To put it succinctly, the mission creep was inevitable.

Print This Post Print This Post
Some gold bulls need a dose of realism

There’s a lot right with John Hathaway’s recent article titled “An ‘Acute Shortage’ in Gold Can Boost Prices“. There’s also a lot wrong with it, beginning with the title. There is not now, there has never been and there never will be a shortage of gold*, the reason being that gold is not ‘consumed’ like other commodities. However, my main bone of contention isn’t with the fatally-flawed argument that a gold shortage is looming.

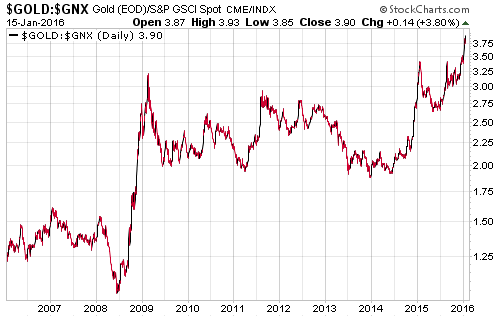
The main problem I have with Hathaway’s article is that it repeats the nonsensical story that the gold price has been forced downward over the past few years to an artificially-low level by the relentless selling of “paper gold”. Like many gold bulls, Hathaway apparently hasn’t noticed that a major commodity bear market has unfolded and that the gold price has held up incredibly well. So well, in fact, that relative to the Goldman Sachs Spot Commodity Index (GNX) the gold price is at an all-time high and about 30% higher than it was at its 2011 peak.

Rather than imagining a grand price suppression scheme involving unlimited quantities of “paper gold” to explain why gold isn’t more expensive, how about trying to explain why gold is now more expensive relative to other commodities than it has ever been.

gold_GNX_180116

Considering only US economic and monetary fundamentals, the gold price is now a lot higher than it probably should be relative to the general level of commodity prices. I think that the strength can be explained by the precarious global economic and monetary situations, but the point is that a knowledgeable and unbiased observer of the markets shouldn’t be scratching his/her head or feeling the need to get creative when coming up with justifications for gold’s current US$ price.

Hathaway actually knows the real reason for gold’s downward trend in US$ terms, because at one point in the article he writes: “The negative investment thesis [for gold] seems to rest upon confidence that central bankers, and the Federal Reserve in particular, will steer a course away from radical monetary experimentation that will return to a normal structure of interest rates and robust economic growth.” Yes, that’s it in a nutshell.

Gold’s perceived value is the reciprocal of confidence in the central bank and the economy. Although some of us strongly believe that the confidence was and is misplaced, it’s a fact that confidence in the Fed and the US economy has generally been at a high level over the past few years.

*Note: If it could be validly argued that a genuine gold shortage (as opposed to a temporary shortage of gold in a particular manufactured form) was likely or even just a realistic possibility, then gold would no longer be suitable for use as money. Fortunately, it cannot be validly argued.

Print This Post Print This Post

Another way to look at the ultimate boom-bust indicator

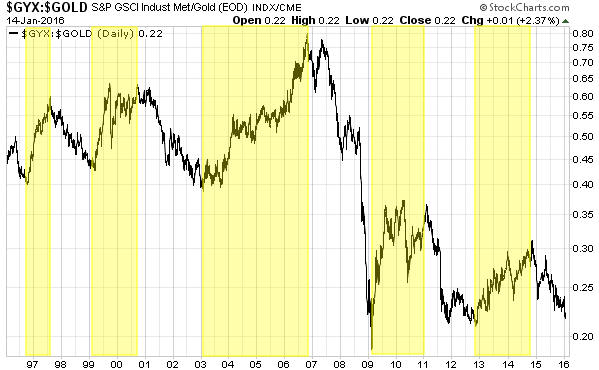
I consider the gold/GYX ratio (the price of gold relative to the price of a basket of industrial metals) to be the ultimate boom-bust indicator. With monotonous regularity, the gold price trends downward relative to the prices of industrial metals during the boom periods and upward relative to the prices of industrial metals during the ensuing busts. Not surprisingly, given economic reality, in addition to being an excellent boom-bust indicator the relative performances of gold and the industrial metals is also an excellent indicator of general (societal) time preference.

Time preference is the value placed on consumption in the present relative to future consumption. In particular, rising time preference involves an increase in the desire to buy consumer goods in the present and, by extension, a decrease in the desire to save or make long-term investments, while falling time preference involves a growing desire to put-off current consumption in order to save or make long-term investments. As an aside, interest rates naturally stem from time preference in that all else being equal — which it often isn’t — people will prefer getting an item now to getting the same item at some future time. For example, even if there is no credit risk, a dollar in the hand today will always have a higher value than the promise of a dollar in the future. The greater perceived value of the present good relative to the future good can be expressed as an interest rate.

Major trends in time preference go hand-in-hand with the boom-bust cycle. During booms fueled by monetary inflation people temporarily feel richer and spend more freely, largely because debt is cheap and easy to come by. This means that booms are accompanied by rising time preference (a greater eagerness to consume). During the ensuing busts, the mistakes and recklessness of the preceding boom come to light. There is a general “pulling in of horns” as the focus turns to the repairing of balance sheets and the building-up of cash reserves. This means that busts are accompanied by falling time preference (a greater desire to save).

Gold is no longer money, in that it is no longer commonly used as a medium of exchange. However, it is widely viewed as a safe and liquid financial asset, rather than a commodity to be consumed. This causes it to perform similarly, relative to other metals, to how it would perform if it were money. In particular, during a period when there’s a general increase in the desire to immediately consume and a concomitant reduction in the desire to hold cash in reserve (a period of rising time preference), the gold price will trend downward relative to the prices of most other metals. And during a period when there’s a general increase in the desire to hold cash in reserve (a period of falling time preference), the gold price will trend upward relative to the prices of most other metals.

In other words, periods of rising time preference are indicated by rising trends in the GYX/gold ratio and periods of falling time preference are indicated by falling trends in the GYX/gold ratio.

On the following chart of the GYX/gold ratio, the periods when the ratio was in a rising trend are shaded in yellow. If you think back to what was happening during these periods you should (hopefully) realise that they were, indeed, periods when societal time preference was rising. Recall how caution was ‘thrown to the wind’ during the NASDAQ bubble of 1999-2000, the real-estate bubble of 2003-2006, the emerging-markets and commodity bubbles of 2009-2010, and the QE-promoted debt bubbles of 2013-2014.

Also, if you think back to what was happening during the unshaded parts of the chart you should realise that these were periods when societal time preference was falling — when investments were revealed as ill-conceived, debts were revealed as unsupportable, and people throughout the economy were collectively spending less in an effort to save more.

GYX_gold_140116

The most recent downturn in societal time preference appears to have been set in motion by the bursting of the shale-oil investment bubble. Many people (not including me) thought that the large decline in the oil price would turn out to be a major plus for the US economy. Just like a tax cut, they claimed. It was actually a negative, though, because substantial debt-funded investments had been predicated on the oil price remaining high.

As to how long the current trend will continue, a lot will depend on whether or not the stock market’s cyclical bullish trend is over. If it is over, which it probably is, then the GYX/gold ratio will continue to fall for at least another 12 months.

The final point I’ll make is that in a free economy that didn’t have a central bank, trends in societal time preference would tend to be more gradual and neither a rising nor a falling time preference would be a problem to be reckoned with. Instead, trends in time preference would influence interest rates throughout the economy in such a way as to provide valid and useful signals to businesses and investors.

Print This Post Print This Post

Unintended Consequences

This post is an excerpt from a commentary posted at TSI about two months ago.

Whenever the government intervenes in the economy in order to bring about what it deems to be a more beneficial outcome than would have occurred in the absence of intervention, there will be winners and losers but the overall economy will invariably end up being worse off. Moreover, it is not uncommon for one of the long-term results of the intervention to be the diametric opposite of the intended result.

A great example of the actual result of government intervention being the opposite of the intended result is contained in a chart that formed part of a recent article at ZeroHedge.com. The chart, which is displayed below, shows the home ownership rate in the US.

Here, in brief, is the story behind the above chart.

During the Clinton (1993-2000) and Bush (2001-2008) administrations the US Federal Government decided that it would be beneficial if a larger number and a broader range of people were home-owners. The government therefore began making a concerted effort to not only increase the US home-ownership rate, but also to make home loans easier to obtain for less-qualified buyers.

This was achieved in part by the more aggressive implementation, beginning in 1993, of the Community Reinvestment Act (CRA) of 1977. Under the cover of the CRA, banks were forced to reduce their lending standards for lower-income groups in general and ‘minorities’ in particular. For example, government regulations created during the 1990s set bank loan-approval criteria and quotas with the aim of increasing loan quantities, and even went so far as to require the use of “innovative or flexible” lending practices to address the credit needs of low-and-moderate-income (LMI) borrowers. Of course, banks that are forced by the government to lower their standards when assessing the loan applications of less-qualified borrowers must also lower their standards for other borrowers, because they can’t reasonably approve an application from one customer and then reject an application from a better-qualified customer.

An increase in the home-ownership rate was also achieved by assigning an “affordable housing mission” to the government-sponsored enterprises (Fannie Mae and Freddie Mac). To make it possible for Fannie and Freddie to achieve this mission their automated underwriting systems were modified to accept loans with characteristics that would previously have been rejected. In addition, Fannie and Freddie cited the new “mission” as a reason that their mortgage portfolios should not be constrained.

At this point we would be remiss not to mention the helping hand provided by the Fed. Without the Fed’s aggressive money-pumping and lowering of interest rates during 2001-2003 there would have been less credit and less money available to the buyers of homes. The Fed’s actions ensured that there would be a credit bubble, while the government’s actions ensured that the residential housing market would be the focal point of the bubble.

The above chart shows that the government was initially — and predictably — successful in its endeavours. The home-ownership rate sky-rocketed as it became possible for almost anyone to borrow money to buy a house. The chart also shows that the home-ownership rate has since collapsed to its lowest level since the 1960s. This collapse was a natural consequence of the credit bubble, in that household balance-sheets were drastically weakened by the taking-on of debt-based leverage during the bubble and the post-bubble plunge in asset prices.

The bottom line is that the interventions designed to increase home ownership ultimately contributed to the home-ownership rate falling to the point where it is now at a multi-generational low. Not just an unintended consequence, but the opposite of the intended consequence.

Print This Post Print This Post

Why is the gold price so high?

With the US$ gold price near a 5-year low, the above question probably seems strange. However, the US$ isn’t the only measure of price.

It is also reasonable to measure gold’s price in terms of other commodities. This is because although gold isn’t just a commodity, under the current monetary system its price should never become divorced from the prices of other commodities. Short-term divergences between gold and the broad-based commodity indices will occur in response to macro-economic developments, but, for example, there isn’t going to be a major upward trend in the gold price while the prices of most other commodities are in major downward trends.

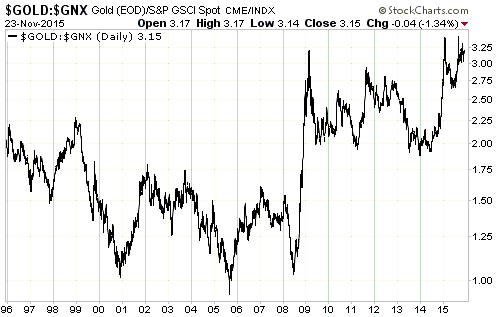
When measured in terms of other commodities, gold’s current price is high. For example, the following chart shows that gold made a new 20-year high relative to the Goldman Sachs Spot Commodity Index (GNX) in January and has recently moved back to near its high.

gold_GNX_231115

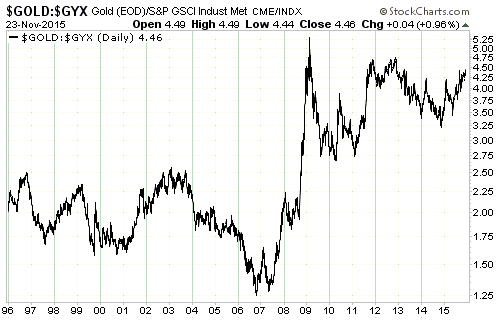
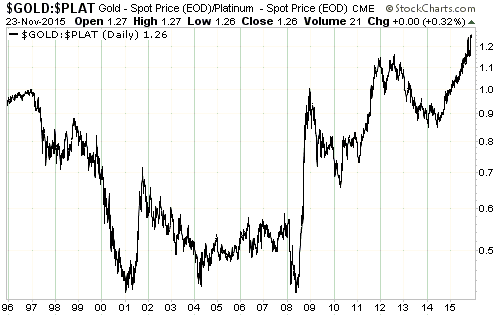
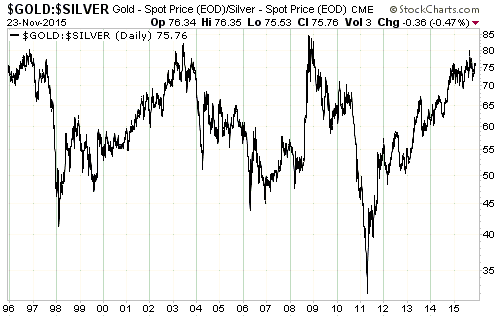
And if we measure gold in terms of other metals rather than commodities in general, it’s a similar story. In particular, the following charts show that a) relative to the Industrial Metals Index (GYX) gold is only 6% below its 2011-2012 highs and within 15% of the 20-year high that was reached at the crescendo of the 2008-2009 global financial crisis, b) gold is at a 20-year high relative to platinum, and c) gold is close to the top of its 20-year range relative to silver.

gold_GYX_231115

gold_plat_231115

gold_silver_231115

Gold normally performs relatively poorly during economic booms and relatively well during economic busts. Gold’s current relatively high price is therefore indicative of a weak global economic situation.

If the global economic backdrop becomes superficially better over the months/quarters ahead and the Fed hikes interest rates as per its current tentative plan, then even if the gold price rises in US$ terms next year it will probably fall in terms of the broad-based commodity indices and most other metals. That, of course, is a big if.

Print This Post Print This Post

A great crash is coming!

One of the interesting aspects of the financial newsletter business is that an incorrect prediction of a market crash will probably drum-up a lot more new business than a correct prediction that there won’t be a crash. Hence, the never-ending popularity of crash-forecasting, despite the fact that such forecasts almost never pan out.

From the perspective of a newsletter writer or any other commentator on the financial markets, the best thing about forecasting a crash is the massively asymmetric reward-risk associated with it. If the market doesn’t crash this year, when it was supposed to according to your original forecast, then you can just say that the event has been delayed and will happen next year instead. You don’t have much to lose because people will soon forget the failed prediction and focus on the next prediction. And if it doesn’t happen next year, then just repeat the process because eventually the market will crash and your amazing prescience will be there for all to see. Furthermore, after you correctly predict a crash there will be thousands of people eager to find out your next big prediction and buy your newsletter/book. In other words, from the forecaster’s perspective the downside of making an incorrect crash forecast is trivial compared to the upside of making a correct crash forecast.

The point is that regardless of how many times you forecast a crash that never happens, you will only have to get lucky once and you will be set for life. From then on you can promote yourself, and be introduced in interviews, as the person who predicted the great crash of XXXX (insert year). From then on a large herd of ‘investors’ will hang on your every word and rush to buy your advice whenever your next big forecast hits the wires.

Having seen how the process works, I’m officially entering the crash forecasting business. My inaugural forecast is for the US stock market to crash during September-October of 2016.

My forecast isn’t a completely random guess, for four reasons. First, stock-market crashes have a habit of occurring in September-October. Second, the two most likely times for the stock market to crash are during the two months following a bull market peak and in the year after a bull market peak (that is, roughly a year into a new bear market). The 1929 and 1987 crashes are examples of the former, while the 1974 and 2008 crashes are examples of the latter. The current situation is that either 1) a bear market began a few months ago, in which case the opportunity to crash during the two months following the bull market peak was missed and the next opportunity will arrive during the second half of 2016, or 2) the bull market is intact, in which case a major peak is likely during the second half of next year. Third, market valuation is high enough to support an unusually-large price decline. Fourth, interest rates are likely to have an upward bias over the next 12 months.

A few months from now a lot of commentators on the financial markets will be forecasting a crash for September-October 2016. If/when the crash happens, remember that you read about it here first and be ready to pay a much higher price (higher than zero, that is) for my next big prediction.

Print This Post Print This Post

Another look at Goldman’s bearish gold view

Early last year I gave banking behemoth Goldman Sachs (GS) credit for looking in the right direction for clues regarding gold’s likely performance, which is something that most gold bulls were not doing. In November I again gave them credit, because, even though I doubted that the US$ gold price would get close to GS’s $1050/oz price target for 2014, their overall analysis had been more right than wrong. It was clear that up to that point the US economy had performed better than I had expected and roughly in line with the GS forecast, which was the main reason that gold had remained under pressure; albeit, not as much pressure as GS had anticipated.

But this year it was a different story. Here’s what I wrote in a TSI commentary in January-2015:

This year, GS’s gold market analysis begins on the right track by stating that stronger US growth should support higher real US interest rates, which would be bearish for gold. Although we expect that the US economy will ‘tread water’ at best and that real US interest rates will be flat-to-lower over the course of this year, GS’s logic is correct. What we mean is that IF the US economy strengthens and IF real US interest rates trend upward in response, there will be irresistible downward pressure on the US$ gold price.

However, the analysis then goes off the rails. After mentioning something that matters (the real interest rate), the authors of the GS gold-market analysis then try to support their bearish case by listing factors that are either irrelevant or wrong. It actually seems as if they’ve taken the worst arguments routinely put forward by gold bulls and tried to use the same hopelessly flawed logic to support a bearish forecast.

For example, they argue that the demand for gold will fall because “inflation” levels are declining along with oil prices. They are therefore unaware, it seems, that “price inflation” has never been an important driver of the gold market and that the latest two multi-year gold rallies began with both “inflation” and inflation expectations low and in declining trends. They also appear to be unaware that the large decline in the oil price is very bullish for the gold-mining industry.

Their analysis then gets even worse, as they imply that the price weakness of the preceding three years is a reason to expect future weakness, whereas the opposite is closer to the truth. They go on to cite outflows from exchange-traded funds (ETFs) and reduced investment in gold coins as bearish influences, apparently unaware that the volume of gold coins traded in a year is always too small to have a noticeable effect on the price and that the change in ETF inventory is a follower, not a driver, of the gold price.

Finally, just when it seems as if their analysis can’t possibly go further off track, it does by asserting that lower jewellery demand and a greater amount of producer hedging will add to the downward pressure on the gold price. The facts are that jewellery demand has always been irrelevant to gold’s price trend and that gold producers are part of the ‘dumb money’ (meaning: they tend to add hedges at low prices and remove hedges at high prices, that is, they tend to do the opposite of what they should be doing based on gold’s intermediate-term risk/reward).

I concluded by stating that in 2014 the GS analysts were close to being right for roughly the right reasons, but that in 2015 they could not possibly be right for the right reasons. They would either be right for the wrong reasons, or they would be wrong.

At this stage it looks like they are going to be wrong about 2015, but not dramatically so. My guess is that gold will end this year in the $1100-$1200 range, thus not meeting the expectations of GS and other high-profile bears and at the same time not meeting the expectations of the bulls. However, GS is on record as predicting a US$1000/oz or lower gold price for the end of next year. I think that this forecast will miss by a wide margin, but I’m not going to make a specific price forecast for end-2016. Anyone who thinks they can come up with a high-probability forecast of where gold will be trading 15 months from now is kidding themselves.

Print This Post Print This Post

Reverse Repo Scare Mongering

Here’s an unmodified excerpt from a TSI commentary that was published a few days ago. It deals with something that has garnered more attention than it deserves and been wrongly interpreted in some quarters.

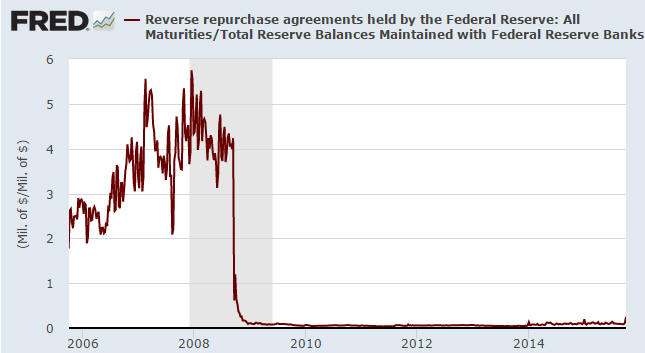
We’ve seen some excited commentary about the recent rise in the dollar volume of Reverse Repurchase (RRP) operations conducted by the Fed. Here’s a chart showing the increase in RRPs over the past few years and the dramatic spike that occurred during the final week of September (the latest week covered by the chart).

For the uninitiated, a reverse repurchase agreement is an open market operation in which the Fed sells a Treasury security to an eligible RRP counterparty with an agreement to repurchase that same security at a specified price at a specific time in the future. The difference between the sale price and the repurchase price, together with the length of time between the sale and purchase, implies a rate of interest paid by the Fed on the cash invested by the RRP counterparty. In short, it is a cash loan to the Fed that is collateralised by some of the Fed’s Treasury securities. The Fed receives some cash, the RRP counterparty receives some securities. Note that the Fed never actually needs to borrow money, but it sometimes does so as part of its efforts to control interest rates and money supply.

As mentioned above, the recent large spike in RRPs has caused some excitement. For example, some commentators have speculated that it signals an effort by the Fed to paper-over a major derivative blow-up. As is often the case in such matters, there are less entertaining but more plausible explanations.

We don’t pretend to know the exact reason(s) for the RRP spike, but here are some points that, taken together, go a long way towards explaining it:

1) The Fed recently enabled a much larger range of counterparties to participate in RRPs. Previously it was just primary dealers, but eligible participants now include GSEs, banks and money-market funds.

2) Reverse Repos involve a reduction in bank reserves, which means that the volume of RRPs is limited to some extent by the volume of reserves held at the Fed. Eight years ago the total volume of reserves at the Fed was almost zero, whereas today it is well over $2T. It could therefore make sense to consider the volume of RRPs relative to the volume of bank reserves.

The following chart does exactly that (it shows RRPs relative to total bank reserves at the Fed). Viewed in this way, the recent spike is a lot less dramatic.

3) Prior to this year RRPs were overnight transactions, but in March of 2015 the FOMC approved a resolution authorizing “Term RRP Operations” that span each quarter-end through January 29, 2016. The Fed has recently been ramping up its Term RRP Operations as part of an experiment related to ‘normalising’ monetary policy.

4) A reverse repo involves the participants parting with the most liquid of assets (cash) for a slightly less liquid asset (Treasury securities), so RRPs are NOT conducted with the aim of boosting financial-system ‘liquidity’. They actually remove liquidity from the financial system.

5) A corollary to point 4) is that because RRPs involve the temporary REMOVAL of money from the financial system, the Fed cannot possibly bail-out or support a bank (or the banking industry as a whole) via RRPs. In effect, a reverse repo is a form of monetary tightening. It is the opposite of “QE”.

6) The recent large increase in the volume of RRPs could be partly due to a temporary shortage of Treasury securities — a shortage that the Fed helped create via its QE and that the US Federal Government has exacerbated by reducing the supply of new securities in response to the closeness of its official “debt ceiling”. That is, the Fed could be using RRPs to alleviate a temporary shortage of government debt securities. However, we suspect that interest-rate arbitrage is playing a larger role, because the RRP participants are getting paid an interest rate that in today’s zero-interest world could look attractive.

7) Lending money to the Fed is the safest way to temporarily park large amounts of cash.

Print This Post Print This Post

Economic busts are not caused by policy mistakes

What I mean by the title of this post is that the central-bank tightening that almost always precedes an economic bust is never the cause of the bust. However, it’s a fact that economic busts are indirectly caused by policy mistakes, in that policy mistakes lead to artificial, credit-fueled booms. Once such a boom has been fostered, an ensuing and painful economic bust becomes unavoidable. The only question is: will the bust be short and sharp (the result if government and its agents stay out of the way) or drag on for more than a decade (the result if the government and its agents try to boost “aggregate demand”)?

The most commonly cited historical case of a policy mistake directly causing an economic bust is the Fed’s gentle tap on the monetary brake in 1937. This ‘tap’ was quickly followed by the resumption of the Great Depression, leading to the superficial conclusion that the 1937-1938 collapse in economic activity would never have happened if only the Fed had remained accommodative.

Let’s now take a look at what actually happened in 1937-1938 that could have caused the economic recovery of 1933-1936 to rapidly and completely disintegrate.

First, while commercial bank assets temporarily stopped growing in 1937, they didn’t contract. Commercial bank assets essentially flat-lined during 1937-1938 before resuming their upward trend in 1939.

Second, outstanding loans by US commercial banks were roughly the same in 1938 as they had been in 1936, so there was no widespread calling-in of existing loans. That is, there was no commercial-bank credit contraction to blame for the economic contraction.

Third, the volume of money held by the public was higher in 1937 than in 1936 and was roughly the same in 1938 as in 1937.

Fourth, M1 and M2 money supplies were roughly unchanged over 1937-1938, so there was no monetary contraction.

Fifth, the consolidated balance sheet of the Federal Reserve system was slightly larger in 1937 than in 1936 and significantly larger in 1938 than in 1937, so there was no genuine tightening of monetary conditions by the Fed at the time.

Sixth, an upward trend in commercial bank reserves that began in 1934 continued during 1937-1938.

Seventh, there were no increases in the interest rates set by the Fed during 1937-1938. In fact, there was a small CUT in the FRBNY’s discount rate in late-1937.

What, then, did the Fed do that supposedly caused one of the steepest economic downturns in US history? The answer is that it boosted commercial-bank reserve requirements.

All of which prompts the question: How did a 1937 increase in reserve requirements that didn’t even lead to a monetary or credit contraction possibly cause manufacturing activity to collapse and unemployment to skyrocket?

It’s a trick question, because the increase in reserve requirements clearly didn’t cause any such thing. The economic collapse of 1937-1938 happened because the recovery of 1933-1936 was not genuine, but was, instead, an artifact of increased government spending and other attempts to prop-up prices. The economy had never been permitted to fully eliminate the imbalances that arose during the late-1920s, so a return to the worst levels of the early-1930s was inevitable.

Many analysts are now worrying out loud that the Fed will repeat the so-called “mistake of 1937″, but the real problem is that the Fed and the government repeated the policy mistakes of the late-1920s and then repeated the policy mistakes of 1930-1936. The damage has been done and another economic bust is now unavoidable, regardless of what the Fed decides at this week’s meeting.

Print This Post Print This Post

Money need not be anything in particular

This post was inspired by an exchange between Martin Armstrong of Armstrong Economics and one of his readers. In an earlier blog entry Mr. Armstrong wrote: “The wealth of a nation is the total productivity of its people. If I have gold and want you to fix my house, I give you the gold for your labor. Thus, your wealth is your labor, and the gold is merely a medium of exchange. So it does not matter whatever the medium of exchange might be.” One of his readers took exception to this comment and argued that money should be tangible and ideally should be gold or silver.

Mr. Armstrong’s reply is worth reading in full. After giving us an abbreviated history of money through the ages, he sums up as follows:

Paper money is the medium of exchange between two people where one offers a service or something they manufactured, which is no different than a gold or silver coin requiring CONFIDENCE and an agreed value at that moment of exchange. You can no more eat paper money to survive than you can gold or silver. All require CONFIDENCE of a third party accepting it in exchange. For the medium of exchange to be truly TANGIBLE it must have a practical utilitarian value and that historically is the distinction of a barter system vs. post-Bronze Age REPRESENTATIVE/INTANGIBLE based monetary systems predicated upon CONFIDENCE.

I agree with Mr. Armstrong’s central point. Many gold advocates assert that gold is “real wealth” and has intrinsic value, which is patently wrong. Value is subjective and will change based on circumstances. For example, you might place a high value on gold in your current circumstances, but if you were stranded alone on an island with no hope of rescue then gold would probably have no value to you. Gold has exactly the same intrinsic value as a Federal Reserve note: zero.

However, he is very wrong when he states: “…it does not matter whatever the medium of exchange might be.” On the contrary, it matters more than almost anything in economics!

The problem with today’s monetary system isn’t that the general medium of exchange (money) has no intrinsic value. As noted above, money also had no intrinsic value when it was gold. The problem with today’s monetary system is that an unholy alliance of banks and government has near-total control of money. Banks have the power to create new money at whim, as does the government via the central bank.

Aside from the comparatively minor problem of causing the purchasing power of money to erode over time, the creation of money out of nothing by commercial banks and central banks distorts the relative-price signals that guide investment. This happens because the money enters the economy in a non-uniform way. In the US over the past several years, for example, most new money entered the economy via Primary Dealers who used it to purchase financial assets from other large speculators. The stock and bond markets were therefore the first and biggest beneficiaries of the new money, which led to an abnormally-large proportion of investment being directed towards strategies designed to profit from rising equity prices and low/falling interest rates. Such investment generally doesn’t add anything to the productive capacity of the economy. In fact, it often results in capital consumption.

Instead of saying “it does not matter whatever the medium of exchange might be”, what Mr. Armstrong should have said was: it does not matter whatever the medium of exchange might be, as long as it is chosen by the free market. Putting it another way, the government should stay out of the money business.

Print This Post Print This Post

The right way to think about gold supply

Here’s the wrong way to think about gold supply: “Although gold’s aboveground inventory is huge compared to current production, only a tiny fraction of this gold will usually be available for sale near the current price. Therefore, changes in mine supply can be important influences on the gold price.” I’ll now explain the right way to think about gold supply.

Whenever I point out that the supply side of the gold market consists of the entire aboveground gold inventory, which is probably somewhere between 150K tonnes and 200K tonnes, and that the gold-mining industry does no more than add about 1.5%/year to this inventory, an objection I often get is that only a tiny fraction of the aboveground inventory is available for sale at any time. This is of course true, and nobody who has a correct understanding of gold supply has ever claimed otherwise.

If all, or even most, of the aboveground supply were for sale at the current price then the price would not be able to rise. The price can rise and fall by substantial amounts, however, because there is always a huge range of prices at which the owners of the aboveground supply are prepared to sell. Moreover, this range is constantly changing based on changing personal circumstances and assessments of the market. In addition, some holders of existing aboveground gold will be planning to hold forever. These plans, which are themselves subject to change in response to changing circumstances, also factor into the formation of the gold price, in that a decision to withhold X ounces of supply can have a similar effect to a decision to buy X ounces.

As I write, gold is trading in the $1120s. It is therefore certain that a tiny fraction of the aboveground supply is currently changing hands in the $1120s and that there are plans in place to sell other tiny fractions in the $1130s, the $1140s, the $1150s, and all the way up to some extremely high number. Some people will also have plans to sell gold if the gold price falls below a particular level and there will be millions of people who have no specific selling intentions who will decide to sell in the future for some currently unforeseeable reason. At the same time there will be countless plans in place to buy at certain levels and millions of people with no present intention to buy who will, for reasons that aren’t currently foreseeable, decide to buy in the future.

It is the combination of these myriad plans that determines the price. Furthermore and as mentioned above, over the days ahead many of these plans will change. For example, some gold-buying/selling intentions will change based on what happens to the stock market or the bond market.

How does the gold-mining industry fit into the situation?

The gold-mining industry is not materially different from any other seller except that its plans are not price sensitive. Specifically, every year it will sell an amount that’s equivalent to about 1.5% of the total aboveground supply regardless of price. At this time four years ago it was selling gold in the $1800s and it is now selling roughly the same amount of gold in the $1100s. It is the ultimate price-taker. To put it another way: whatever price arises from the changing plans of gold owners and potential owners, that’s the price at which gold producers will sell.

On a related matter, due to the huge existing aboveground supply of gold there should never be a genuine shortage of physical gold. Obtaining more gold should always be solely a question price. A consequence is that the gold market should never go into “backwardation”, that is, the spot gold price should always be lower than the price for future delivery. Just to be clear: in an abundantly-supplied commodity market the futures price should be higher than the spot price by enough to eliminate the risk-free profit that could otherwise be had by selling the physical and buying the futures. That’s why it would be very significant if the gold market were to make a sustained and sizeable move into backwardation. Such a development would indicate that holders of the aboveground supply were withdrawing their gold from the market en masse and/or that the gold futures market was breaking down due a collapse in trust. Even the small and brief backwardations of the past two years have some significance*, although recent gold backwardation episodes have more to do with near-zero short-term US$ interest rates than gold supply/demand. The point is that gold backwardation is only important because the existing aboveground supply in saleable form dwarfs the rate of annual production.

In summary, the price of gold is where it is because of the range of prices at which existing holders intend to become sellers and the concurrent range of prices at which potential future holders intend to become buyers. These ranges are constantly in flux due to changing perceptions and circumstances.

*Keith Weiner has written extensively about the significance of gold backwardation at https://monetary-metals.com/.

Print This Post Print This Post