Why the yield curve changes direction ahead of a recession

Print This Post Print This Post

Why the yield curve changes direction ahead of a recession

[This post is an excerpt from a TSI commentary]

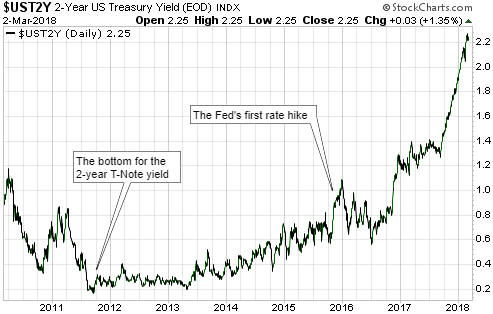
Conventional wisdom is that an inversion of the yield curve (short-term interest rates moving above long-term interest rates) signals that a recession is coming, but this is only true to the extent that a recession is always coming. A reversal in the yield curve from flattening to steepening is a far more useful signal.

What a yield curve inversion actually means is that the interest-rate situation has become extreme, but there is no telling how extreme it will become before the eventual breaking point is reached. Furthermore, although there was a yield-curve inversion prior to at least the past seven US recessions, Japan’s most recent recessions were not preceded by inverted yield curves and there is no guarantee that short-term interest rates will rise by enough relative to long-term interest rates to cause the yield curve to become inverted prior to the next US recession. In fact, a good argument can be made that due to the extraordinary monetary policy of the past several years the start of the next US recession will NOT be preceded by a yield curve inversion.

Previous US yield curve inversions have happened up to 18 months prior to the start of a recession, and as mentioned above it’s possible that there will be no yield curve inversion before the next recession. Therefore, we wouldn’t want to be depending on a yield curve inversion for a timely warning about the next recession or financial crisis. However, the yield curve can provide us with a much better, albeit still imperfect, recession/crisis warning in the form of a confirmed trend reversal from flattening to steepening. This was discussed in numerous TSI commentaries over the years and was also covered in a blog post last December.

There are two reasons that a reversal in the yield curve from flattening to steepening is a more useful recession/crisis warning signal. First, it is timelier. Second, it should work regardless of whether or not the yield curve becomes inverted.

Now, from a practical speculation standpoint it is not essential to understand WHY the yield curve reverses from flattening to steepening ahead of major economic problems bubbling to the surface. It is enough to know that it does. However, if you understand why the curve has reversed direction ahead of previous recessions you will understand why it either should or might not reverse direction in a timely manner in the future. After all, if extraordinary monetary policy could prevent the yield curve from becoming inverted ahead of the next recession then perhaps it also could prevent the yield curve from reversing course the way it has in the past.

With regard to understanding the why, the first point to grasp is that the boom phase of the cycle is characterised by borrowing short-term to lend/invest long-term. This puts upward pressure on short-term interest rates relative to long-term interest rates, meaning that it causes the yield curve to flatten. Also, when the boom is mature and is approaching its end there will be a scramble for additional short-term financing to a) complete projects that were started when monetary conditions were easier and b) address cash shortages that have arisen due to completed projects not delivering the predicted cash flows. This puts further upward pressure on short-term rates relative to long-term rates, and could, although won’t necessarily, cause the yield curve to become inverted.

Next, as the boom nears its end the quantity of loan defaults will begin to rise and the opportunities to profit from short-term leverage will become scarcer. Everything will still seem fine to casual observers, central bankers, the average economist and the vast majority of commentators on the financial markets, but it will now be apparent to a critical mass of astute operators (investors, speculators and financiers) that many of the investments that were incentivised by years of easy money were ill-conceived. These operators will begin shifting towards ‘liquidity’ and away from risk.

The aforementioned increasing desire for the combination of safety and liquidity leads to greater demand for cash and gold. But more importantly as far as this discussion is concerned, it boosts the demand for short-term Treasury debt relative to long-term Treasury debt (thus putting downward pressure on short-term interest rates relative to long-term interest rates). The reason is that the shorter the term of the Treasury debt, the lower the risk of an adverse price movement. For example, if you lend $10B to the US government via the purchase of 3-month T-Bills then in three months’ time you will have something worth $10B, but if you lend $10B to the US government via the purchase of 10-year T-Notes then in three months’ time you could have something that is worth significantly more or less than $10B.

As an aside, what an investor focused on boosting liquidity really wants is cash, but if he has billions of dollars then cash is not a viable option. This is because the cash would have to be deposited in a bank, which means that the investor would be lending the money to a bank and taking the risk of a massive loss due to bank failure. Lending to the US government is a much safer choice.

In summary, it’s mainly the desire for greater liquidity and safety that begins to emerge at the tail-end of a boom that causes the yield curve to stop flattening and start steepening. As demonstrated by the events of the past few years the central bank has substantial power to postpone the end of a boom, but eventually a breaking point will be reached and when it is the yield curve’s trend will change from flattening to steepening.

Print This Post Print This Post

The rising interest-rate trend

The rising interest-rate trend in the US isn’t new and isn’t related to the Fed’s so-called “policy normalisation” program. However, it has only just started to matter.

That the rising interest-rate trend isn’t new and isn’t related to the Fed’s rate-hiking efforts is clearly illustrated by the following chart. This chart shows that the US 2-year T-Note yield began trending upward in 2011 — more than 6 years ago and more than 4 years prior to the Fed’s first rate hike.

UST2Y_050318

As we go further out in duration we find later beginnings to the rising-yield trend. This is evidenced by the following three charts, the first of which shows that the 5-year yield bottomed in mid-2012, the second of which shows that the 10-year yield double-bottomed in mid-2012 and mid-2016, and the third of which shows that the 30-year yield continued to make lower lows until mid-2016. But even in the case of the 30-year yield the rising trend is now more than 18 months old.

UST5Y_050318

UST10Y_050318

UST30Y_050318

Given that US interest rates have been rising for more than 6 years at the short end and more than 18 months at the long end, why has the trend suddenly begun to draw a lot of attention in the mainstream press?

The answer is: because rising yields on credit instruments have begun to put downward pressure on equity prices. The stock market is capable of ignoring rising interest rates for long periods, as has been demonstrated by the market action of the past few years. However, if a rising interest-rate trend persists for long enough it transforms, as far as the stock market is concerned, from an irrelevance to the most important thing.

The way that interest rates gradually turned upward over several years despite the relentless downward pressure applied by the central bank suggests that we are dealing with the end of a very long-term decline. In other words, there’s a good chance that we are now in the early stages of a 1-2 decade (or longer) rising interest-rate trend. But how could that be, when debt levels are very high and the economy-wide savings rate is very low?

Under the current monetary regime, major upward trends in interest rates are not driven by the desire to consume more in the present (the desire to save less) or by rapidly-increasing demand for borrowed money to invest in productive enterprises. That, in essence, is a big part of the problem — interest-rate trends do not reflect what they should reflect. Instead, major upward trends in interest rates are driven primarily by rising inflation expectations, or, to put it more aptly, by declining confidence in money.

Of particular relevance, under the current monetary regime it is not only possible for a large, general increase in the desire to save to be accompanied by rising interest rates, it is highly probable that when a large rise in interest rates happens it will be accompanied by a general desire to save more. It’s just that the desire for greater savings won’t manifest itself as a greater desire to hold cash. It will, instead, manifest itself as a desire to hold more of something with near-cash-like liquidity that is not subject to arbitrary devaluation by central banks and governments. Gold is the most obvious example.

Print This Post Print This Post

Oil, the Yuan and the dollar-based monetary system

[This post is an excerpt from a commentary posted at TSI about two weeks ago]

Some commentators have made a big deal over the Yuan-denominated oil futures contract that will soon begin trading in Shanghai, but in terms of effect on the global currency market this appears to be a very small deal.

With or without a Yuan-denominated oil futures market there is nothing preventing the suppliers of oil to China from accepting payment in Yuan. In fact, some of the oil imported by China is already paid for in Yuan. Having a Yuan-denominated oil futures contract may encourage some additional oil trading to be done in China’s currency because it would enable suppliers to reduce their risk via hedging, but the main issue is that the Yuan is not a useful currency outside China. Unless an international oil exporter was interested in making a large investment in China, getting paid in Yuan would create a problem of what to do with the Yuan.

In any case, the monetary value of the world’s daily oil consumption is less than 0.1% of daily trading volume on the foreign exchange market, and the foreign exchange market is dominated by the US$. Despite the popular (in some quarters) notion that the US$ is in danger of losing its leading role within the monetary system, at last count the US$ was on one side of 88% of all international transactions. The euro, the world’s other senior fiat currency, was at around 30% (and falling). The Yuan’s share of the global currency market is very small (less than 3%), and according to the following chart could be in a declining trend.

The point we were trying to make in the above paragraph is that a change in how any country pays for its oil imports will not have a big effect on the global currency market. Actually, the cause-effect works the other way around. The pricing of oil in US dollars is not, or at least is no longer, even a small part of the reason that the US$ dominates the global currency system, but the fact that the US$ dominates the global currency system causes most international oil exporters to demand payment in US dollars.

The US$ sometimes rises and sometimes falls in value relative to other currencies, but it always dominates global money flows. Like it or not, that’s the nature of today’s monetary system.

The current monetary system is US$-based and in all likelihood will remain so until it collapses and gets replaced by something different. In other words, it’s unlikely — we almost would go as far as to say impossible — for the current system to persist while another currency gradually superseded the US$. The reason is that there is no viable alternative to the US$ among today’s other major fiat currencies.

We don’t have a strong opinion on what the post-collapse “something different” will be. One possibility is a system based on gold, but there could also be an attempt to create a global fiat currency. The world’s political leadership and financial establishment would certainly favour the latter possibility, but we fail to see how it could work as it would essentially be the botched euro experiment on a much grander scale.

Print This Post Print This Post

The “petrodollar” is irrelevant

A recent article posted at Casey Research trumpets the view that the petrodollar system is on its last legs and that when it dies — quite possibly in 2017 — it will be a massively disruptive event for the US economy and the financial world, leading to an explosion in the gold price. The reality is that the so-called “petrodollar” is probably not about to expire, but even if it were the economic consequences for the US and the world would not be dramatic.

According to the “petrodollar system” theory, an agreement was reached in 1974 between the governments of the US and Saudi Arabia for the Saudis to do all of their oil transactions in US dollars and influence other OPEC members to do the same. In return, the US government vowed to support and protect the Saudi regime. Also according to this theory, the US economy benefits because the pricing of oil in US dollars creates additional global demand for US dollars and US assets.

The agreement might have happened, but there is no good reason that it would still be in effect. Considering the popularity of the US dollar in global trade and the size of the US economy, an agreement between the Saudi and US governments would no longer be required to entice the Saudis to price their oil exports in dollars. It would be inconvenient for them to do otherwise.

In any case, even if the “petrodollar” agreement happened and remains in effect to this day it would not be of great importance. The reason is that the international trading of oil accounts for only a minuscule fraction of international money flows.

To further explain, global oil production is about 96M barrels per day (b/d), but only part of this gets traded internationally. For example, US oil consumption is about 19M b/d, but the US now produces about 10M b/d so the US is a net importer of only about 9M b/d. The amount of oil that gets traded between countries and could therefore add to the international demand for US dollars is estimated to be around 50M b/d.

Assuming that all of the aforementioned 50M b/d of oil gets traded in US dollars, at an oil price of $50/barrel the quantity of dollars employed per year in the international trading of oil amounts to about 900 billion. In other words, the maximum positive effect on global US$ usage of the “petrodollar” system is about $900 billion per year.

Next, note that according to the most recent survey conducted by the Bank for International Settlements, as of April 2016 the average daily turnover in global foreign exchange markets was about $5.1 trillion. With the US$ estimated to be on one side of 88% of all FX trades, this means that an average of 4.5 trillion US dollars change hands every day on global FX markets.

Therefore, the quantity of US dollars traded per DAY on the FX markets, primarily for investing and speculating purposes, is roughly 5-times the amount of US dollars used per YEAR in the international oil trade. That’s why the so-called “petrodollar” is not important.

In conclusion, here’s a suggestion: Instead of focusing on outlandish reasons for buying gold, focus on the less exciting but vastly more plausible reasons that gold’s popularity could rise.

Print This Post Print This Post

An age-old relationship between interest rates and prices

The chart displayed near the end of this discussion is effectively a pictorial representation of what Keynesian economists call a paradox* (“Gibson’s Paradox”) and Austrian economists call a natural and perfectly understandable relationship.

Gibson’s Paradox was the name given by JM Keynes to the observation that interest rates during the gold standard were highly correlated to wholesale prices but had little correlation to the rate of “inflation”, that is, that interest rate movements were connected to the level of prices and not the rate of change in prices. It was viewed as a paradox because most economists couldn’t explain it. According to conventional wisdom, interest rates should have been positively correlated with the rate of “price inflation”.

The problem is that most economists did not — and still do not — understand what interest rates are.

First and foremost, interest rates are the price of time. They reflect the fact that, all else being equal, humans place a higher value on getting something now than on getting exactly the same thing at some future time. Interest rates transcend money, because they exist even when money does not. With or without money and all else being equal, getting something now will always be worth more than getting the same thing in the future**. This is called time preference.

Time preference is the root of interest rates and the natural interest rate is a measure of societal time preference. That is, the natural interest rate is a measure of the general urgency to consume in the present or the amount that would have to be paid, on average, to make saving (the postponement of consumption) worthwhile. For example, the average 7-year-old child has a very high time preference, in that if you give the kid a choice between getting a desirable toy today or getting something more in 3 months’ time, the “something more” option won’t be chosen unless it is a LOT more, whereas a middle-aged adult with substantial savings is likely to have low time preference.

When interest rates are properly understood it becomes clear that the paradox named after Gibson is no paradox at all. The reason is that if the money is sound, as it mostly was under the Gold Standard, both interest rates and prices will move in the same direction in response to changes in societal time preference.

To further explain, during a period of rising time preference, that is, during a period when there is an increasing desire to consume in the present, the prices of goods will rise (on average) due to increasing demand and it will take a higher interest rate to encourage people to delay their spending. During a period of falling time preference, that is, during a period when there is an increasing desire to save, the prices of goods will fall (on average) and people will generally accept a lesser incentive (interest rate) to delay their spending.

In a nutshell, there is no paradox because, when the money is sound, interest rates don’t drive prices and prices don’t drive interest rates; instead, on an economy-wide basis*** both prices and interest rates are driven by changes in societal time preference.

That’s all well and good, but we no longer have sound money. Moreover, we have massive, continuous manipulation of interest rates by central banks. The signal that interest rates should send is therefore now being overwhelmed by central-bank-generated noise to the point where it’s a miracle (a testament to the resilience of entrepreneurial spirit, actually) that we still have a functioning economy. Quite remarkably, though, signs of the age-old relationship between interest rates and the price level can still be found if you know where to look.

The signs aren’t apparent when interest rates are compared with an official wholesale price index, because a great effort is expended by the central planners to ensure that the official money loses purchasing power year-in and year-out regardless of what’s happening in the world. However, the signs are apparent when interest rates are compared to a wholesale price index based on gold.

The commodity/gold ratio is the price of a broad-based basket of commodities in gold terms. In essence, it is a wholesale price index using gold as the monetary measuring stick. Although gold is no longer money in the true meaning of the term (it is no longer the general medium of exchange), it is still primarily held for what can broadly be called ‘monetary purposes’ and in many respects it trades as if it were still money. According to the age-old relationship discussed above and labeled “Gibson’s Paradox” by a confused JM Keynes, the commodity/gold ratio should generally move in the same direction as risk-free interest rates.

The risk-free US interest rate that is least affected by the direct manipulation of the Fed is the yield on the 30-year T-Bond, so what we should see is a positive correlation between the commodity/gold ratio and the T-Bond yield. Or, looking at it from a different angle, what we should see is a positive correlation between the gold/commodity ratio and the T-Bond price. That’s exactly what we do see.

Using the Goldman Sachs Spot Commodity Index (GNX) to represent commodities, the following chart shows that the age-old relationship has worked over the past 10 years when gold is the monetary measuring stick. It has also worked over the past 20 years, although there was a big divergence — possibly due to the ‘China effect’ on commodity prices or the ECB’s aggressive money pumping — in 2005.

I like this chart because it makes economic sense and because it can be helpful when trying to anticipate the next important turning point for the gold/commodity ratio and/or the T-Bond.

GCvsUSB_140217

*As a general rule, if your theory leads to a paradox then your theory is wrong.

    **There are many real-life examples of a premium being paid to receive a good in the future rather than the present, but in such cases all is not equal. That is, in such cases there will be a difference between the future good and the present good that makes the future good more valuable. For example, an oil refiner will generally pay more for a barrel of oil to be delivered in six months’ time than a barrel of oil to be delivered immediately, because if it doesn’t plan to refine the oil until 6 months from now it can save 6 months of storage costs by purchasing oil for future delivery. To put it another way, in this oil-refiner example a barrel of oil for immediate delivery is priced at a discount because it comes with 6 months of storage-related baggage.

    ***For any specific interest-rate-related transaction, credit risk will be very important. As a result, at any given time there will be a wide range of interest rates within an economy even if the money has no “inflation” risk. However, it is reasonable to think of time preference as an interest-rate floor that rises and falls. In effect, time preference determines the interest rate that would apply on average throughout the economy if there were no credit or inflation risks.

Print This Post Print This Post

The illogical world of GATA

In response to the 3rd January blog post in which I pointed out the straightforward fact that evidence of market manipulation is not necessarily evidence of price suppression, a reader sent me a link to a year-old GATA article. The GATA article was presented by the reader as a refutation of what I had written.

It is certainly possible to construe the aforelinked GATA article as having at least partly refuted what I wrote, but only if you take the article’s headline (“State Dept. cable confirms gold futures market was created for price suppression”) and conclusion (“…[the cable confirms] the assertions by GATA and others in the gold-price suppression camp that futures markets function largely as mechanisms of commodity price suppression and support for government currencies”) at face value and give no further thought to what is being presented and asserted.

However, if you take the time to read the excerpt from the 1974 State Dept. cable included in the GATA article you will see that it does NOT say that the gold futures market was created for price suppression; it says that re-legalising private gold ownership in the US (it had been illegal since 1933) would result in the formation of a large and liquid futures market. In effect, it says that the formation of a futures market would be a natural consequence of the gold market becoming freer.

The State Dept. cable does express an opinion that large-volume futures dealing would create a highly volatile market, and that the volatile price movements would diminish the initial demand for physical holding and most likely reduce the long-term hoarding of gold by U.S. citizens. This opinion is certainly debatable, as a good argument can be made that futures markets tend to bring about LESS long-term volatility in the price of a commodity. In any case, it is just an opinion as to the price-related consequences of a naturally-occurring futures market.

It is also worth mentioning that the cable is from an embassy bureaucrat with no say in government policy.

So, in no way does the State Dept. cable do what the author of the GATA article claims it does. Moreover, the assertion that “futures markets function largely as mechanisms of commodity price suppression and support for government currencies” is not only in no way backed-up by the evidence presented, it is so illogical as to be laughable. There have been futures markets for many widely-traded commodities for hundreds of years. These markets were not created by and do not exist for the benefit of governments.

Sometimes, no specialised knowledge is needed to figure out that a conclusion doesn’t follow from the information presented. For example, detailed knowledge of the gold futures market is not needed to see that the State Dept. cable cited in the GATA article does not come remotely close to confirming GATA’s assertions. Sometimes, all that’s needed is a modicum of logic.

Print This Post Print This Post

An economy can’t be modeled by simple equations

A modern economy typically involves millions of individuals making decisions about consumption, production and investment based on a myriad of personal preferences. It should be obvious that such a ‘system’ could never be properly described by any mathematical equation, let alone a simple one-line equation. And yet, many economists and other commentators on economics-related matters base their analyses on simple equations.

One of the most popular of these simple equations is also one of the most misleading. I’m referring to the following GDP formula:

GDP = C + I + G + X – Z, where C is consumer expenditure, I is investment, G is government expenditure, X is exports, and Z is imports.

This equation has numerous problems, beginning with the fact that GDP, itself, is a fatally-flawed measure of economic performance in that it treats a dollar of counter-productive spending as if it were just as good as a dollar of productive spending. In essence, it measures activity without considering whether the activity adds to or subtracts from total wealth. But rather than dealing with all of this equation’s problems, I’ll zoom in on its implication that an economy can be boosted via an increase in government spending (G). This implication is not only wrong, it’s dangerous.

Government spending involves taking (stealing or borrowing) money that would have been used by the private sector and then directing the money towards politically-motivated, as opposed to economically-motivated, uses.

Even if we put aside the most basic problems with the GDP concept and the above equation, there’s no good reason to believe that an increase in G will lead to an increase in GDP. This is because C, I and G are not independent variables. In particular, since the government obtains all of its resources from the private sector it is reasonable to expect that an increase in G would lead to an offsetting reduction in C+I. Furthermore, this reasonable expectation is supported by historical data, which reveal a long-term inverse correlation between government-spending growth and GDP growth.

Moving on, another of the most popular of the economics profession’s simple equations is also misleading. I’m referring to the famous equation of exchange, which can be expressed as M*V = P*Q where M is the money supply, V is the velocity of money, Q is the total quantity of transactions in the economy and P is the average price per transaction.

There are numerous problems with this equation, starting with the fact that it says nothing other than the total monetary value of all transactions in the economy equals the total monetary value of all transactions in the economy. In other words, it’s a tautology. As such, it provides no useful information.

In this tautological equation, V (velocity) is nothing more than a fudge factor that makes one side equal to the other side. V doesn’t exist outside of this equation, meaning that it has no relationship to the real world.

In the real world there is money supply and there is money demand. There is no “money velocity”. It makes no more sense to talk about the velocity of money than it does to talk about the velocity of gold or the velocity of bonds or the velocity of bananas or the velocity of houses.

Some of the people who talk about “money velocity” as if it were a genuine economic driver probably mean “money demand”, in which case they should say “money demand”. Money demand is certainly both real and important, but it can’t be calculated via a simple equation.

For more on the Equation of Exchange and the irrelevance of Money Velocity, please refer to my June-2015 blog post on the topic.

In conclusion, when a piece of analysis treats equations such as the ones mentioned above as if they were realistic models of how the economy works, at a superficial level it can make the analysis seem more scientific. However, it actually makes the analysis less scientific.

Using mathematical models that don’t reflect reality is part of why the economics profession has such a dismal track record and is generally held in low regard.

Print This Post Print This Post

Where did all the money go?

The prices of US government debt securities have been falling since early-July and plunged over the past two weeks. This prompts the question: Where did all the money that came out of the bond market go?

It’s a trick question, because not a single dollar has left the bond market. The reason is that for every sale there has been an exactly offsetting purchase. For example, if Bill sells $100M of T-Bonds, then $100M of cash gets transferred from the account of the buyer (let’s call him Fred) to Bill’s account. After the transaction, Bill has $100M more cash and $100M less bonds while Fred has $100M less cash and $100M more bonds. There has been no net flow of money out of or into the bond market.

In general terms, no money ever goes into or out of any market. A market, after all, is just a place where people go to trade. A market can grow or shrink, but it is not an entity that receives or disgorges money. Furthermore, every transaction in a market involves an increase in demand and an exactly offsetting decrease in demand. For example, in the case of the hypothetical bond traders mentioned above, the transaction involved an increase in the demand for bonds on the part of Fred and an exactly offsetting decrease in the demand for bonds on the part of Bill. Or, looking at it from a different angle, it involved an increase in the demand for money on the part of Bill and an exactly offsetting decrease in the demand for money on the part of Fred.

Related to the fact that no money ever goes into or out of any market is the fact that apart from a relatively small physical float, all of the money in the economy is always in the banking system*. It just gets shuffled around between the accounts of buyers and sellers. This, by the way, is why the “cash on the sidelines” argument that is regularly made to support a bullish stock market forecast is nonsense. In effect, all of the money in the economy is always on the sidelines.

Why, then, do market prices rise and fall?

Market prices rise and fall because one side (the buyers or the sellers) become more eager than the other side. If buyers are generally more eager than sellers then the price will rise by the amount required to encourage enough new sellers and/or discourage enough buyers so that a balance is established, whereas if sellers are generally more eager than buyers then the price will fall by the amount required to encourage enough new buyers and/or discourage enough sellers to establish a balance.

That’s why it sometimes happens that the prices of ‘everything’ (equities, bonds, gold, commodities) trend upward or downward together. One price doesn’t have to go down in order for another price to go up, and prices in one market going down will never be the direct cause of prices in another market going up. Although it is certainly the case that rising/falling prices in one market can alter the motivations of buyers and sellers in another market. The price of gold, for example, is determined mostly by what’s happening to prices in the bond, currency and stock markets.

Clearly, then, US government bond prices have fallen simply because, on average, bond sellers over the past few months have been more eager/motivated than bond buyers, not because any money has come out of the bond market. The reason for the change in motivation is a good topic for a separate post.

*If governments and banks get their way, at some point in the not-too-distant future there will be no physical float and 100% of the money supply will be in the banking system.

Print This Post Print This Post

Update on the Comex fear-mongering

Over the past few years there has been a lot of irrational fear-mongering within the gold commentariat regarding the potential for the Comex to default due to having insufficient physical gold in its coffers. I most recently addressed this topic in a post on 6th May.

I’m not going to repeat all the information contained in earlier posts such as the one linked above. However, here’s a very brief recap:

1) The ratio of Comex Open Interest (OI) to “Registered” gold inventory that Zero Hedge et al employed to create the impression of high default risk was not, in any way, shape or form, a valid indicator of such risk.

2) The amount of gold available for delivery at any time is the TOTAL amount of gold in the “Registered” and “Eligible” categories, not just the amount of “Registered” gold, since it is a quick and easy process to convert between “Eligible” and “Registered”.

3) The maximum amount of gold that can be demanded for delivery is the amount of OI in the nearest futures contract, not the total OI across all futures contracts.

In the above-linked post I included a chart showing that the amount of gold delivered to futures ‘longs’ over the preceding two years was much less in both absolute and relative terms than at any other time over the past decade. The chart made it clear that as the gold price fell, the desire of futures traders to ‘stop’ a contract and take delivery of physical gold also fell.

This meant that the unusually-small amount of gold in the “Registered” category was almost certainly related to an unusually-low desire on the part of futures ‘longs’ to take delivery. To put it another way, the unusually-small amount of gold in the “Registered” category was nothing more than a natural consequence of bearish sentiment.

Here was my conclusion at that time:

It’s a good bet that if a multi-year gold rally began last December (I think it did) then the desire to take delivery will increase over the next couple of years, prompting a larger amount of gold to be held in the Registered category.

Finally, here are charts from goldchartsrus.com showing that this year’s strength in the gold price led to 1) an increase in the desire of futures ‘longs’ to take delivery and 2) a related and substantial increase in the amount of “Registered” gold.

Exactly as expected.

gold_COMEXdeliv_071116

RegisteredGoldStock_071116

Print This Post Print This Post

Hyperinflation is coming to the US…

but possibly not in your lifetime.

As I mentioned in a blog post back in April of last year, I have never been in the camp that exclaims “buy gold because the US is headed for hyperinflation!”. Instead, at every step along the way since the inauguration of the TSI web site in 2000 my view was that the probability of the US experiencing hyperinflation within the next 2 years — on matters such as this there is no point trying to look ahead more than 2 years — is close to zero. That remains my view today. In other words, I think that the US has a roughly 0% probability of experiencing hyperinflation within the next 2 years.

I also think that the US has a 100% probability of eventually experiencing hyperinflation, but this belief currently has no practical consequences. There is no good reason to start preparing for something that a) is an absolute minimum of two years away, b) could be generations away, and c) is never going to happen with no warning. With regard to point c), we will never go to bed one day with prices rising on average by a few percent per year, 10-year government bond yields below 2% and the money supply rising at around 8% per year and wake up the next day with hyperinflation.

It takes a considerable amount of time (years, not days or weeks) to go from the point when the vast majority is comfortable with and has confidence in the most commonly used medium of exchange (money) to the point when there is a widespread collapse in the desire to hold money. Furthermore, many policy errors will have to be made and there will be many signs of declining confidence along the way.

The current batch of policy-makers in central banking and government as well as their likely replacements appear to be sufficiently ignorant or power-hungry to make the required errors, but even if the pace of destructive policy-making were to accelerate it would still take at least a few years to reach the point where hyperinflation was a realistic short-term threat in the US.

In broad terms, the two prerequisites for hyperinflation are a rapid and unrelenting expansion of the money supply and a large decline in the desire to hold money. Both are necessary.

To further explain, at a time when high debt levels and taxation underpin the demand for money, a collapse in the desire to hold money could not occur in the absence of a massive increase in the money supply. By the same token, a massive increase in the money supply would not bring about hyperinflation unless it led to a collapse in the desire to hold money.

Over the past three years the annual rate of growth in the US money supply has been close to 8%. While this is above the long-term average it is well shy of the rate that would be needed to make hyperinflation a realistic threat within the ensuing two years. Furthermore, high debt levels in the US and counter-productive policy-making in Europe will ensure that there is no substantial decline in the desire to hold/obtain US dollars for the foreseeable future.

The upshot is that there are many things to worry about, but at this time US hyperinflation is not one of them.

Print This Post Print This Post

The relentless COMEX fear-mongering

321gold.com’s Bob Moriarty recently took someone to task for making the wrongheaded assertion that there was a high risk of the CME (usually still called the COMEX) defaulting due to the amount of paper claims to gold being orders of magnitude greater than the amount of physical gold in store. Bob makes the correct point that a default isn’t possible because the COMEX allows for cash settlement if necessary. However, the assertions being made by the default fear-mongers aren’t just wrong due to a failure to take into account the cash settlement provision; they would be complete nonsense even if there were no cash settlement provision. I’ve briefly explained why in previous blog posts (for example, HERE). In this post I’ll supply a little more detail.

I suspect that when it comes to the idea that a COMEX default is looming, ZeroHedge.com is “fear-monger zero*”. Every now and then ZeroHedge posts a chart showing the total Open Interest (OI) in COMEX gold futures divided by the amount of “Registered” gold in COMEX warehouses. An example is the chart displayed below, which was taken from the article posted HERE. The result of this division is supposedly the amount of gold that could potentially be demanded for delivery versus the amount of gold available for delivery, with extremely high numbers for the ratio supposedly indicating that there is a high risk of a COMEX default due to insufficient physical gold in storage. I say “supposedly”, because it actually indicates no such thing. The ratio routinely displayed by ZeroHedge — and other gold market ‘pundits’ who spout the same baloney — is actually meaningless.

ZH_goldcover_050516

One reason it is meaningless is that the amount of gold available for delivery is the amount of “Registered” gold PLUS the amount of “Eligible” gold, meaning the TOTAL amount of gold at the COMEX. It is true that only Registered gold can be delivered against a contract, but it is a quick and simple process to convert between Eligible and Registered. In fact, much of the gold that ends up getting delivered into contracts comes from the Eligible stockpile, with the conversion from Eligible to Registered happening just prior to delivery.

Taking a look at the ratio of COMEX Open Interest to total COMEX gold inventory via the following chart prepared by Nick Laird (www.sharelynx.com), we see that it has oscillated within a 3.5-6.5 range over the past 7 years and that nothing out of the ordinary happened over the past three years.

COMEXOI_TOTINV_050516

Another reason that the OI/Registered ratio regularly displayed by ZeroHedge et al is meaningless is that the total Open Interest in gold futures is NOT the amount of gold that could potentially be demanded for delivery. The amount of gold that could potentially be demanded for delivery is the amount of open interest in the nearest contract. For example, when ZeroHedge posted its dramatic “Something Snapped At The Comex” article in late-January to supposedly make the point that there were more than 500 ounces of gold that could potentially be called for delivery for every available ounce of physical gold, in reality there were about 15 ounces of physical gold in COMEX warehouses for every ounce that could actually have been called for delivery into the expiring (February-2016) contract.

Although it provides no information about the ability of short sellers to deliver against expiring futures contracts when called to do so, it is reasonable to ask why the ratio of total OI to Registered gold rose to such a high level. I can only guess, but I suspect that the following chart (also from www.sharelynx.com) contains the explanation.

The chart shows the cumulative stopped contract deliveries, or the amount of gold that was delivered into each expiring contract, in absolute terms and relative to open interest. Notice the downward trend beginning in late-2011. Notice also that the amount of gold delivered to futures ‘longs’ over the past two years is much less in both absolute and relative terms than at any other time over the past decade.

It is clear that as the gold price fell, the desire of futures traders to ‘stop’ a contract and take delivery of physical gold also fell. In other words, the unusually-small amount of gold maintained in the Registered category over the past two years reflects the unusually-low desire on the part of futures ‘longs’ to take delivery.

It’s a good bet that if a multi-year gold rally began last December (I think it did) then the desire to take delivery will increase over the next couple of years, prompting a larger amount of gold to be held in the Registered category.

COMEXDELIV_050516

In conclusion, the fact is that at no time over the past several years has there been even a small risk of either a COMEX default or the COMEX falling back on its cash settlement provision. However, this fact is obviously not as exciting as the fiction that is regularly published by scare-mongers in their efforts to attract readers and separate the gullible from their money.

*The equivalent of Patient Zero in an epidemiological investigation.

Print This Post Print This Post

Martin Armstrong botches a critique of Austrian Economics

Just once I’d like to read a negative critique of “Austrian” economics from someone who actually understands it, but up until now every piece of criticism I’ve come across has contained basic misunderstandings of what this school of economics is about. The latest example is a 6th November blog post by Martin Armstrong.

According to the beliefs expressed by Mr. Armstrong in the above-linked blog post, Austrian Economics informs us that “fiat” money causes the business cycle and that the business cycle began with the Industrial Revolution. Both of these beliefs are completely wrong. Austrian Economics does not say that the business cycle is caused by fiat money and it does not say that the business cycle began with the Industrial Revolution.

Austrian Economics informs us that the business cycle is caused by large increases in the supply of money that create the impression that there are more real savings in the economy than is actually the case. Over the past few centuries the dominant cause of these large money-supply increases in the most developed economies was “fractional reserve banking”, a practice that effectively began with goldsmiths issuing more receipts for gold than they had actual gold in their vaults. However, “Austrian Business Cycle Theory” does not revolve around the specific method via which the monetary inflation occurs. A king debasing the coinage or issuing large quantities of paper money could potentially have a similar effect to goldsmiths issuing unbacked receipts for gold or an economy being flooded with gold — in the days when gold was money — due to successful foreign conquest (e.g. Spain and the Conquistadors in the 1500s) or commercial banks lending new money into existence or modern central banks implementing QE.

As to the other of Mr. Armstrong’s aforementioned beliefs, anyone who has gone to the trouble of researching Austrian Economics would know that “Austrian” economists have analysed the monetary and economic developments that occurred throughout history. As a good economic theory should, Austrian Economics works in all circumstances. It works regardless of whether we are dealing with a large modern city, a small village, a man alone on an island, a free economy, a command economy, an economy that uses paper money, an economy that uses tangible money, a robust economy, an economy immersed in depression, and so on.

Towards the end of his post Mr. Armstrong makes two assertions that aren’t specifically related to Austrian Economics, but warrant clarification.

First, he writes:

…tangible money must have a “use” other than money. Gold and silver were prized objects but had no utilitarian “use” value outside of jewelry. Gold was desirable but was not a vital commodity that served a purpose beyond its prized status like art. Therefore, numerous monetary systems have existed that were not gold based since the medium of exchange had to have a “use” value other than as money.

The fact is that many things have been used as money throughout the ages, but the more advanced economies ended up gravitating towards gold and/or silver. One reason is that for an item to become money in a large and mostly-free economy it must have a use other than money, but the non-monetary demand for the item will ideally be very small — to the point of being trivial — relative to the monetary demand. Otherwise, changes in non-monetary demand could cause large and unpredictable swings in the purchasing-power of money. That’s why if markets were free to choose they would almost certainly not choose platinum as money, even though platinum has similar physical attributes to gold.

Second, he writes:

Money is not a store of value; it is a medium of exchange. In that case, it is merely an agreed upon medium to supplant barter.

This is mostly correct. However, if an item isn’t widely perceived to be a good store of value then in a free market it won’t generally be accepted as a medium of exchange and therefore won’t be money.

Print This Post Print This Post

There is no economic yardstick

My two “Gold Is Not Money” articles (HERE and HERE) provoked numerous disagreeing responses, the majority of which were polite and well-meaning. Despite presenting various arguments, these responses had one thing in common: they did not offer a practical definition of money that gold currently meets. As I mentioned previously, a practical definition of money cannot avoid the primary economic role of money, which is to facilitate indirect exchange*. If something is not generally used to facilitate indirect exchange, then regardless of what other attributes it has it cannot be money; at least not in the way that money is commonly understood today and has been commonly understood through the ages. When people willingly perform logical contortions in an effort to show that something is money even though it doesn’t fulfill the primary role of money, all they are actually showing is the lengths to which they are prepared to go to ignore a reality that is not to their liking. Would gold perform the monetary role far better than the US$ and any of the other monies in common use in the developed world today? Yes. Would I rather that gold was money today? Yes. Is gold money today? Unfortunately, no. However, the main purpose of this post isn’t to rehash the reasons that gold can no longer be correctly viewed as money in any developed economy. It’s to consider the claim, which was made by more than a few of the respondents to my “Gold Is Not Money” posts, that gold is an economic constant.

Such a claim ignores good economic theory. Gold, like all of the elements, is a physical constant, but there is no such thing as an economic constant or yardstick. The reason is that value is always subjective. Every individual will have his/her own opinion on what gold is worth and these opinions will change based on circumstances.

Currently, most people in the Western world own no gold and have no intention of buying gold. This will change, but the reality is that gold is presently very low on the ‘utility scale’ of the average person. At the same time, there are plenty of people who place a high value on gold, which is why gold’s price is what it is.

The market price at any time reflects the collection of all the differing opinions about value, but the market price is constantly changing. The market price, therefore, does not measure value in the way that the mass of a physical quantity can be measured.

The claim that gold is an economic constant also ignores the historical record. For example, there has been a large decline in gold’s purchasing-power (PP) over the past 4 years. Prior to that, there was a huge gain in gold’s PP during 2001-2011, a huge decline in gold’s PP from January-1980 through to early-2001, and a spectacular rise in gold’s PP during 1971-1980. Over the same period the dollar’s PP has been vastly more stable, although certainly far from constant.

It could be argued that the large swings in gold’s PP over the past 45 years are due to changes in the perception of the official monetary system. This is true — the perceived value of gold as an investment or a speculation or a vehicle for saving has undergone large oscillations over the past 45 years due to changing perceptions of the US$ (money in the US). These oscillations are secondary evidence that gold is no longer money in the world’s largest economy, the primary evidence being that it isn’t generally used as a medium of exchange.

It should also be understood that gold was not an economic constant even when it was money. In general terms, even the best money imaginable would not be an economic constant, because even if its supply were kept constant its demand would be continually changing. Again, we stress that there is no such thing as an economic constant (an UNCHANGING quantity against which everything else can be measured).

When gold was money neither its supply nor its demand were ever constant over what most people would consider to be a normal investment timeframe or holding period, although it still performed admirably in the monetary role. It would have performed even better — and its reputation would not have been unfairly tarnished — if fractional-reserve banking had not been permitted. Fractional-reserve banking was to blame for the financial crises that occasionally erupted during the Gold Standard era.

Over extremely long periods the swings in gold’s PP have evened-out in the past, but something that starts at a certain level and can be relied on to return to that level at some unknown point in the distant future cannot be legitimately called a “constant”. Moreover, to be useful as money it isn’t necessary that something maintain relatively stable purchasing power over centuries; it is necessary that it maintain relatively stable purchasing-power from one year to the next.

Something won’t survive as money if it tends to experience wild swings in its purchasing-power over periods of a few years or less, but it can survive as money if its PP can be relied on to change by no more than a few percent in either direction from one year to the next. There is no need for money to have constant PP to remain useful as money, which is just as well because economic constancy is an impossible dream.

*Here’s what I mean by “indirect exchange”. In an economy without money a tomato farmer who wanted bread would have to find a baker who wanted tomatoes. A direct exchange of ‘wants’ could then take place. However, in an economy with money a tomato farmer who wanted bread could sell his tomatoes to anyone in exchange for money and then use the money to buy bread. This is an indirect exchange of ‘wants’, with money providing the link.

Print This Post Print This Post

The Mythical Silver Shortage

This post is an excerpt from a recent TSI commentary.

Excited talk of a silver shortage has made its annual reappearance. This talk is always based on anecdotal evidence of silver coins or small bars being difficult to obtain in some parts of the world via retail coin dealers. It never has anything to do with the overall supply situation.

Shortages of silver and gold in certain manufactured forms favoured by the public will periodically arise, often because of a sudden and unanticipated (by the mints) increase in the public’s demand for these items. Furthermore, the increase in the public’s demand is often a reaction to a sharp price decline, the reason being that in the immediate aftermath of a sharp price decline the metals will look cheap regardless of whether they are actually cheap based on the fundamental drivers of value.

These periodic shortages of bullion in some of the manufactured forms favoured by the public are not important considerations when assessing future price potential. The main reason is that the total volume of metal purchased by the public in such forms is a veritable drop in the market ocean. For example, the total worldwide volume of silver in coin form purchased by the public in a YEAR is less than the amount of silver that changes hands via the LBMA in an average trading DAY.

If gold continues to rally over the weeks ahead then silver will also rally. By the same token, if gold doesn’t rally over the weeks ahead then neither will silver. In other words, regardless of any anecdotal evidence of silver shortages at coin shops, silver’s short-term price trend will be determined by gold’s short-term price trend. Furthermore, if the gold price rises then the silver price will probably rise by a greater percentage, the reason being that the silver/gold ratio is close to a multi-decade low (implying: silver is very cheap relative to gold).

A final point worth making on this topic is that the claims of silver or gold shortages that periodically spring-up are not only misguided, they are dangerous. This relates to the fact that the most popular argument against gold and silver recapturing their monetary roles is that there isn’t enough of the stuff to go around. The gold and silver enthusiasts who cry “major shortage!” whenever it temporarily becomes difficult to buy coins from the local shop are therefore effectively supporting the case AGAINST the future use of gold and silver as money. You see, a critical characteristic of money is that obtaining it is always solely a question of price.

Print This Post Print This Post

The meaning of the 6-year low in GLD’s bullion inventory

At the end of the week before last the amount of physical gold held by the SPDR Gold Trust (GLD), the largest gold bullion ETF, fell to its lowest level since September-2008. What does this tell us?

In many TSI commentaries over the years and in a couple of posts at the TSI blog over the past year I’ve explained that changes in GLD’s bullion inventory are not directly related to the gold price. Neither a large rise nor a large fall in the gold price would necessarily require a change in GLD’s inventory, the reason being that as a fund that holds nothing other than gold bullion the net asset value (NAV) of a GLD share will naturally move by the same percentage amount as the gold price.

However, there is an indirect relationship between the gold price and GLD’s bullion inventory. At least, there has been such a relationship in the past. I am referring to the long-term correlation between the gold price and the GLD inventory that stems from changes in sentiment.

As traders in GLD shares become more optimistic about gold’s prospects they sometimes buy aggressively enough to push the market price of GLD above its NAV, which prompts an arbitrage trade by Authorised Participants (APs) involving the issuing of new GLD shares and the addition of physical gold to GLD’s inventory. And as traders in GLD shares become more pessimistic about gold’s prospects they sometimes sell aggressively enough to push the market price of GLD below its net asset value (NAV), prompting an arbitrage trade by APs involving the redemption of GLD shares and the removal of physical gold from GLD’s inventory.

That is, changes in GLD’s market price relative to its NAV create opportunities for arbitrage trades that adjust the supply of GLD shares and the amount of physical bullion held by the fund, thus ensuring that the market price never deviates far from the NAV. This modus operandi is common to all ETFs.

Since traders in GLD shares tend to become more optimistic in reaction to a rising price and less optimistic in reaction to a falling price, the most aggressive buying of GLD shares will tend to occur after the gold price has been trending higher for a while and the most aggressive selling of GLD shares will tend to occur after the gold price has been trending lower for a while. This explains why the following chart shows that the long-term correlation between the gold price and the GLD inventory is strongly positive and why the major downward trend in GLD’s inventory began well after the 2011 peak in the gold price.

The upshot is that the price trend is the cause and the GLD inventory is the effect.

In conclusion, here are three implications of the above:

1) Anyone who claims that the gold price has trended lower over the past few years due to the selling of gold from GLD’s inventory is getting cause and effect mixed up.

2) Anyone who claims that gold is being removed from GLD’s inventory to satisfy demand in Asia (or elsewhere) is either clueless about how ETFs work or is telling untruths to promote an agenda.

3) The early-August decline in GLD’s bullion inventory to a new multi-year low was consistent with the price action. It was evidence that GLD traders were getting increasingly bearish in reaction to lower prices. They loved it at $1600-$1900 and they hated it below $1100.

Print This Post Print This Post

The futures price is not a price prediction

The price of a commodity futures contract is not the market’s forecast of what the spot price will be in the future. For example, the fact that at the time of writing the price of the December-2016 WTI Crude Oil futures contract is $64.44 does not imply that ‘the market’ expects the price of oil to rise from around $59 (the current spot price) to around $64 by the end of next year. Moreover, the true message of the difference between the futures price and the spot (cash) price can be the opposite of the superficial message, in that the lower the futures price relative to the spot price the more bullish the price implication. If you understand why this is so then you understand more than former Fed chief and present-day blogger Ben Bernanke about how the commodity futures markets work, which, admittedly, is not saying very much.

Part of the reason that the price of a commodity futures contract is not a prediction of the future price of the commodity is that many of the largest participants in the futures markets do not buy/sell futures contracts based on a forecast of what’s going to happen to the price. Instead, they use the futures market to hedge their exposure in the cash market. For example, when an oil producer sells oil futures it is probably doing so because it wants to lock-in a cash flow, not because it expects the price to go down.

The main reason, however, is that the difference between the futures price and the spot price is driven by arbitrage and, in all commodity markets except the gold market, the extent to which current production is able to satisfy current demand (in the gold market there can never be a supply shortage because almost all of the gold mined in world history is still available to meet current demand). In effect, regardless of what people think the price of the commodity will be in the future, arbitrage trading will prevent the futures price from deviating from the spot price after taking into account the cost of credit (the interest rate) and the cost/availability of storage.

Considering the case of the oil market, I mentioned above that the spot price is currently about $59 and the price for delivery in December-2016 is about $64. This $5 difference does not imply that ‘the market’ expects the price of oil to be $5/barrel higher in December-2016 than it is today; it implies that the cost of storing oil for the next 18 months plus the interest income that would be foregone (or the interest that would have to be paid) equates to about $5/barrel. If not, there would be a risk-free arbitrage profit to be had.

For example, if a large speculator who was very bullish on oil bid-up the price of the December-2016 oil contract from $64 to $70, it would create an opportunity for other traders to lock-in a profit by purchasing physical oil and selling the December-2016 futures with the aim of delivering the oil into the contracts late next year. This trade (selling the December-2016 futures and buying the physical) would continue until the difference between the spot and futures prices had fallen by enough to eliminate the profit potential.

For another example, if a large speculator who was very bearish on oil aggressively short-sold the December-2016 oil contract, driving its price down from $64 to $60, it would create an opportunity for other traders to lock-in a profit by selling physical oil and buying the December-2016 futures with the aim of eventually replacing what they had sold by exercising the futures contracts. Even though in this example the December-2016 futures contract is still $1 above the spot price, there is a profit to be had because the cost of storage plus the time value of money amounts to significantly more than the $1/barrel futures premium.

I also mentioned above that the true message of the difference between the futures price and the spot (cash) price can be the opposite of the superficial message, in that the lower the futures price relative to the spot price the more bullish the price implication. I’ll use the same oil example to explain why.

As I pointed out, if the futures price falls by enough relative to the spot price it will lead to a situation where there is an essentially risk-free arbitrage profit to be made by selling the physical and buying the futures. However, this trade is only possible if the physical market is well supplied. If this isn’t the case and all the oil being produced is needed for current consumption, then the price of oil for future delivery can drop to an unusually low level relative to the spot price and stay there. If the current supply situation is tight enough then the futures price could even drop below the spot price. That’s why a sustained situation involving an unusually-low futures price relative to the spot price has bullish, not bearish, price implications.

My final point is that one of the most important influences on the difference between spot and futures prices for many commodities is the prevailing interest rate. In the gold market it is the most important influence by a country mile. The lower the interest rate the smaller the difference will tend to be between the spot price and the prices for future delivery, so in a world dominated by ZIRP (Zero Interest Rate Policy) the differences between spot and futures prices will generally be smaller than usual.

In conclusion, anyone who views an unusually-large premium in the commodity futures price as bullish and an unusually-low (or negative) premium in the commodity futures price as bearish is looking at the market bass-ackwardly.

Print This Post Print This Post

Money is never backed by anything

One of the criticisms of the current monetary system is that the money isn’t backed by anything. However, while there are some big problems with the current system, this criticism isn’t valid. The reason is that money is never backed by anything.

Taking the specific case of the US dollar, the view that the US$ should be backed by something and the related view that the absence of backing implies a major flaw is a hangover from the Gold Standard. Under the Gold Standard that existed in the US prior to the early-1930s, a US dollar represented and was exchangeable into a fixed amount of gold.

The critical point is that under the Gold Standard the US$ wasn’t money; gold was money. The US dollars in circulation were receipts or IOUs that entitled the bearer to a certain amount of gold (money). The dollar itself wasn’t money. At most, it was a “money substitute”.

Today’s paper dollars are not IOUs or receipts. They are not “money substitutes”, they are money proper. Consequently, they do not need to be backed by anything. In fact, if they were backed by something then whatever was doing the backing would be money and the dollar itself would be a money substitute rather than actual money.

The situation isn’t as clear with regard to dollars in bank deposits as it is with regard to paper dollars, as the dollars in bank deposits are backed by the promise of the banking system to convert from electronic to paper on demand. It could therefore be argued that electronic dollars in bank deposits are money substitutes rather than money, although it is reasonable to count them in the money supply because the central bank has the ability to meet any demand for the conversion of electronic dollars into paper dollars.

The fact that today’s money isn’t backed by anything is therefore not the problem. If gold were money then the money also wouldn’t be backed by anything. That’s the nature of money. The problem, instead, is that for something to be GOOD money its supply should be fairly stable and it should be widely perceived to have value outside its role as a medium of exchange. The US dollar and all of today’s official monies fail to meet either of these requirements, whereas cryptocurrencies such as Bitcoin fail to meet the second requirement.

Print This Post Print This Post

Cambodia, Gresham’s Law and Corruption

Over the most recent Christmas and New Year holiday period, one of the places I visited (with wife and 15-year-old son) was Siem Reap in Cambodia. The town of Siem Reap is best known for, and is a popular tourist destination largely because of, its close proximity to the ruins of Angkor, the capital of Cambodia during the Khmer Empire (9th to 15th Century). Angkor contains the — in some cases largely intact or restored — remnants of some huge temples, including Angkor Wat. However, if (like me) you quickly get bored with temple viewing, Siem Reap is still worth visiting. The town is so vibrant and friendly, with so many interesting eating/drinking places, shops and markets, that I actually wouldn’t mind living there. But the purpose of this post isn’t to discuss the things to see and do in Siem Reap, it’s to discuss some economics-related observations I made while visiting that part of the world.

On arriving at the Siem Reap airport and spending about one hour making our way through the chaotic immigration section I was finally at the document-checking counter, where I had all five digits on both hands scanned for prints. After completing the tedious finger-scanning process I offered to provide a urine sample, but apparently it wasn’t necessary. I thought about giving it to them anyway, but then thought better of it.

What a totally counterproductive exercise in a place that is heavily reliant on tourism! Fortunately, it turned out that the airport was the only bad experience we had in Siem Reap. Not coincidentally, the airport is one of the few parts of the town that is totally controlled by the government. The government, by the way, claims to be democratically elected, but in reality Cambodia is a one-party state headed by a former member of the Khmer Rouge.

The main reason to bring up the airport experience isn’t to complain about the ridiculous security measures and the general inefficiency of the place, it’s because this is where I made the novice mistake of exchanging some US dollars for the local currency, known as the Riel. I didn’t convert much money, thinking that the airport exchange rate would be unattractive, but I shouldn’t have converted any. The reason is that everyone in Siem Reap prefers to deal in US dollars. To put it more accurately, they prefer US dollars to the Riel when receiving payment, although they are happy to give you change in Riel. So, in Siem Reap and perhaps all of Cambodia there are two monies: the money generally perceived to be good (the US$) and the money generally perceived to be not so good (the Riel). This leads me to Gresham’s Law. Cambodia is a good example of why the popular understanding of Gresham’s Law, although it might seem reasonable at first or even second glance, often doesn’t apply in practice.

The popular adaptation of Gresham’s Law is: bad money drives out good. This concept seems to make sense, because people will naturally prefer to hoard the good money and part with the bad money when buying things. However, it generally doesn’t work that way in practice because people will naturally prefer to receive the good money when selling things, so for a trade to take place it will often be necessary for the buyer to offer the good money.

That’s the popular understanding of Gresham’s Law, but the actual principle is: “When a government overvalues one type of money and undervalues another, the undervalued money will leave the country or disappear from circulation into hoards, while the overvalued money will flood into circulation.” That is, Gresham’s Law really only applies in the specific case where there are two equally acceptable types of money and the government fixes the exchange rate between the two. The classic example — and the most relevant example for hundreds of years prior to the last century — is where gold and silver are the most common media of exchange in an economy and the government fixes the gold/silver ratio too high or too low. Actually, even if the ratio is initially set at roughly the right level, changes in the supply of and the demand for the two metals over time will eventually result in one becoming over-valued relative to the other at the official exchange rate. This will lead to the relatively expensive (that is, over-valued) commodity being used progressively more in trade and the relatively cheap (that is, under-valued) commodity being progressively removed from circulation.

In Siem Reap the two types of money aren’t equally acceptable, and although there is an official exchange rate it seemed that people were generally able to trade at whatever rate they deemed appropriate. Consequently, the “bad money” is not driving out the “good money”. On the contrary, the “good money” is thriving as a medium of exchange.

My final Cambodia note is about corruption. Most people believe that all corruption is bad, but in terms of effect on the economy there is both good and bad corruption.

Good corruption is when a government regulation, that for no sensible reason makes it much more difficult for businesses to provide the service that their customers want, can be cheaply ‘got around’ by slipping some money into the pocket of a government rep. In other words, good corruption greases the wheels of commerce. It shouldn’t be required, but in the real world the government puts many unnecessary obstacles in the way of voluntary exchange. An example of good corruption is covered in Jeffrey Tucker’s article about former Washington D.C. mayor Marion Barry.

Bad corruption is when representatives of the government greatly increase the cost of doing business for the purpose of enriching themselves. It is Mafia-style extortion that puts additional obstacles in the way of voluntary exchange.

In Cambodia I saw examples of bad corruption that I suspect are just the tip of the iceberg. In particular, although the town of Siem Reap is a little chaotic (in a good way), it seems that a government licence is required for almost everything. Even setting up a stall selling fried grasshoppers by the side of the road well outside the main town requires a licence. This is not necessarily a big deal by itself, but I found out about cases where the requirement to get a licence made the cost of going into business prohibitive due to the amount of money that has to be paid ‘under the table’ in addition to the official licence fee. For example, I was told that to become a travel agent you must get a licence and to get the licence you must first pass an exam, but that regardless of how well you do in the exam you will not be given a passing grade unless you pay a relatively large bribe to the government-appointed examiner. This is bad corruption. Good corruption would entail slipping a small sum of money to someone to avoid the silly requirement of having to sit the exam.

In conclusion, Siem Reap is a part of the world where good and bad money openly compete, which is the way it should be. It is a great place to visit and perhaps even to live for a while, but I get the impression that it wouldn’t be a great place to set up a business.

Print This Post Print This Post

Right for the wrong reasons

It is not uncommon for people who make predictions about the financial markets to be right for the wrong reasons, meaning that even though their reasoning turned out to be wrong the market ended up doing roughly what was predicted. Here are two examples that explain what I’m talking about.

The first example involves the popular forecast, during 1995-2000, that the US stock market would continue to be propelled upward by a technology-driven productivity miracle. This reasoning was used by high-profile analysts such as Abby Joseph Cohen to explain why stratospheric valuations would go even higher. As long as the bull market remained intact these analysts were generally held in high regard, but their reasoning was terribly flawed.

Anyone with a basic understanding of good economic theory knows that increasing productivity causes prices to fall, not rise. Furthermore, while it is certainly possible for some individual companies to justifiably obtain higher market valuations by becoming more productive than their competitors, a general increase in productivity will not cause a sustained, economy-wide increase in corporate profitability and will not justify higher valuations for most equities. To put it another way, the main beneficiaries of higher productivity are consumers, not stock speculators and investors in equity-index funds. Consequently, there was never a possibility that rising productivity was behind the 1995-2000 surge in the US stock market. “Rising productivity” was just a story that sounded good to the masses while the market was going up.

Like all bull markets in major asset classes, the bull market in US equities that ended in 2000 was driven by the expansions of money and credit. After the pace of monetary expansion slowed, the bull market naturally collapsed.

The second example involves the forecast, in 2011-2012, that the gold price was destined to fall a long way due to deflation. Regardless of whether your preferred definitions of inflation and deflation revolve around money supply, credit supply, asset prices or consumer prices, there has been no deflation and plenty of inflation over the past 2-3 years, so advocates of the “gold is going to lose a lot of value due to deflation” forecast could not have been more wrong in their reasoning. However, the gold market has performed as predicted!

Rather than being a victim of deflation, gold was a victim of the reality that over the past three years a bout of rampant monetary inflation led to a huge rally in the broad stock market, which, in turn, boosted economic confidence. Ironically, had the reasoning of the “gold to fall due to deflation” group been close to the mark, the gold price would probably have experienced nothing more than a 12-18 month consolidation following its September-2011 peak. This is not because gold benefits from deflation (it doesn’t), but because the combination of economic weakness, declining economic confidence and the actions taken by central banks to address the economic weakness would have elevated the investment demand for gold.

I’ve noticed that fundamentals-based analysis is rarely questioned if it matches the price action and, by the same token, is often greeted with skepticism if it is in conflict with a well-established price trend. During a raging bull market even the silliest bullish analyses tend to be viewed as credible, and after a bear market has become ‘long in the tooth’ even a completely illogical or irrelevant piece of analysis will tend to be viewed as smart, or at least worthy of serious consideration, if its conclusion is bearish. However, from a practical investing perspective, fundamental analysis can be most useful when its conclusions are at odds with the current price trend. The reason is that the greatest opportunities for profit in the world of investing and long-term speculation are created by divergences between value and price.

Print This Post Print This Post