Basic Gold Market Facts

Print This Post Print This Post

Basic Gold Market Facts

Here are ten basic gold-market realities that are either unknown or ignored by many gold ‘experts’.

1. Supply always equals demand, with the price changing to maintain the equivalence. In this respect the gold market is no different from any other market that clears, but it’s incredible how often comments like “demand is increasing relative to supply” appear in gold-related articles.

2. The supply of gold is the total aboveground gold inventory, which is currently somewhere in the 150K-200K tonne range. Mining’s contribution is to increase the aboveground inventory by about 1.5% each year. An implication is that there should never be a shortage of gold.

3. Although supply always equals demand, the price of gold moves due to sellers being more motivated than buyers or the other way around. Moreover, the change in price is the only reliable indicator of whether the demand side (the buyers) or the supply side (the sellers) have the greater urgency. An implication is that if the price declines over a period then we know, with 100% certainty, that during this period sellers were more motivated (had greater urgency) than buyers.

4. No useful information about past or future price movements can be obtained by counting-up the amount of gold bought/sold in different parts of the gold market or different parts of the world. An implication is that the supply/demand analyses put out by GFMS and used by the World Gold Council are generally useless in terms of explaining past price moves and assessing future price prospects.

5. Demand for physical gold cannot be satisfied by “paper gold”.

6. Prices in the physical and paper (futures) markets are linked by arbitrage trading. For example, if speculative selling in the futures market drives the futures price down relative to the physical (or cash) price by a sufficient amount then arbitrage traders will profit by selling the physical and buying the futures, and if speculative buying in the futures market drives the futures price up relative to the physical (or cash) price by a sufficient amount then arbitrage traders will profit by selling the futures and buying the physical.

7. The change in the spread between the cash price and the futures price is the only reliable indicator of whether a price change was driven by the cash/physical market or the paper/futures market.

8. In a world where US$ interest rates are much lower than usual, the difference between the price of gold in the cash market and the price of gold for future delivery will usually be much smaller than usual. In particular, when the T-Bill yield is close to zero, as is the case today, there will typically be very little difference between the spot price of gold and the price for delivery in a few months. An implication is that in the current financial environment the occasional drift by gold into “backwardation” (the futures price lower than the spot price) will not be anywhere near as significant as it would be under more normal interest-rate conditions.

9. Major trends in the US$ gold price are determined by changes in the general level of confidence in the Fed and the US economy. An implication is that major price trends have nothing to do with changes in jewellery demand, mine supply, scrap supply, central bank buying/selling, and the amounts of gold being imported by India and China.

10. The amount of gold in COMEX warehouses and the inventories of gold ETFs follow the major price trend, meaning that changes in these high-profile inventories are effects, not causes, of changes in the gold price.

Print This Post Print This Post

The gold-backed Yuan fantasy

Assuming that useful price clues are what you want, it’s pointless to analyse the flow of gold into China and within China. I explained why HERE, HERE and HERE. I’ll write about the bogus ‘China gold demand’ theory again in the future as it’s one of the most persistent false beliefs within the bullish camp, but in this post I’m going to quickly deal with another China-related false belief that periodically shifts to the centre of the bullish stage: the idea that China’s government is preparing to back the Yuan with gold.

I was going to write in detail about why a gold-backed Yuan is a pipe dream, but then I discovered Geoffrey Pike’s article on the same topic and realised that doing so would be akin to reinventing the wheel. This is because the aforelinked article encapsulates the argument I would have attempted to make. You should click on the link and read the entire piece (it isn’t long), but here’s the conclusion:

There is no way that the Chinese central planners are going to voluntarily give up an enormous amount of power by going to some form of a gold standard. It would drastically reduce their ability to spend money. It would reduce their power. It would limit their ability (or lack of) to centrally plan the economy.

Given that there are good reasons to expect gold to resume its long-term bull market in the not-too-distant future, why do so many bullish gold analysts argue their cases using the equivalent of fairy stories?

Print This Post Print This Post

Gold is not a play on “CPI inflation”

I have never been in the camp that exclaims “buy gold because the US is headed for hyperinflation!”. Instead, at every step along the way since the inauguration of the TSI web site in 2000 my view has been that the probability of the US experiencing hyperinflation within the next 2 years — on matters such as this there is no point trying to look ahead more than 2 years — is close to zero. That is still my view. In other words, I think that the US has a roughly 0% probability of experiencing hyperinflation within the next 2 years. Furthermore, at no time over the past 15 years have I suggested being ‘long’ gold due to the prospect of a rapid rise in the CPI. This is partly because at no time during this period, including the present, has a rapid rise in the CPI seemed like a high-probability intermediate-term outcome, but it is mainly because gold has never been and is never likely to be a play on “CPI inflation”.

Gold is a play on the economic weakness caused by bad policy and on declining confidence in the banking establishment (led by the Fed in the US). That’s why cyclical gold bull markets are invariably born of banking/financial crisis and/or recession, and why a cyclical gold bull market is more likely to begin amidst rising deflation fear than rising inflation fear.

There are times when the declining economic/monetary confidence that boosts the investment demand for gold is linked to expectations of a rapid increase in “price inflation”, but it certainly doesn’t have to be. For example, the entire run-up in the gold price from its 2001 bottom to its 2011 peak had nothing to do with the CPI. Also, an increase in the rate of “CPI inflation” would only ever be bullish for gold to the extent that it brought about declining confidence in the economy or the banking establishment, as indicated by credit spreads, real interest rates, the BKX/SPX ratio and the yield curve. Since it’s possible for the CPI to accelerate upward without a significant decline in confidence, it’s possible that an upward acceleration in the CPI would not be bullish for gold.

The bottom line is that as far as the gold market is concerned, the CPI is more of a distraction than a driver. 

Print This Post Print This Post

The crappy gold-mining business revisited

[This post is a slightly-modified excerpt from a recent TSI commentary.]

Last October I wrote a piece that explained why gold mining had been such a crappy business since around 1970 and why it was destined to remain so as long as the current monetary system was in place. The explanation revolved around a boom-bust cycle and the associated mal-investment linked to the monetary machinations of central banks.

The crux of the matter is that when the financial/banking system appears to be in trouble or it is widely feared that central banks are playing fast and loose with the official money, the stock and bond markets are perceived to be less attractive and gold-related investments are perceived to be more attractive. However, gold to the stock and bond markets is like an ant to an elephant, so the aforementioned shift in investment demand results in far more money making its way towards the gold-mining industry than can be used efficiently. Geology exacerbates the difficulty of putting the money to work efficiently, in that gold mines typically aren’t as scalable as, for example, base-metal mines or oil-sands operations.

In the same way that the mal-investment fostered by the Fed’s monetary inflation has caused the US economy to effectively stagnate over the past 15 years, the bad investment decisions fostered by the periodic floods of money towards gold mining have made the industry inefficient. That is, just as the busts that follow the central-bank-caused economic booms tend to wipe out all the gains made during the booms, the gold-mining industry experiences a boom-bust cycle of its own with even worse results. The difference is that the booms in gold mining roughly coincide with the busts in the broad economy.

In a nutshell, the relatively poor performance of the gold-mining industry over the past several decades is an illustration of what the Fed and other central banks have done, and are continuing to do, to entire economies.

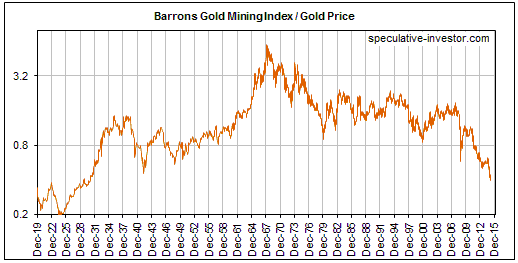
Obviously, gold itself is not made less valuable by the monetary-inflation-caused inefficiencies and widespread wastage that periodically beset the gold-mining industry. That’s why gold bullion has been making higher highs and higher lows relative to the average gold-mining stock since the late-1960s, and why the following weekly chart shows that the BGMI/gold ratio (the Barrons Gold Mining Index relative to gold bullion) is now at its lowest level since the 1920s.

When the next bust gets underway in the broad economy, the surging demand for gold will temporarily generate huge real gains for gold-stock investors. At the same time it will lead to yet another round of massive mal-investment in the gold-mining industry that ensures the eventual elimination of these gains

Print This Post Print This Post

Total guesswork regarding China’s gold holdings

Last year I noticed an article by Alasdair Macleod containing an estimate that China (meaning: China’s government) had accumulated 25,000 tonnes of gold between 1983 and 2002. I would say that this estimate was based on rank speculation, but that would be doing an injustice to rank speculation. It is more like total guesswork. It is largely based on assumptions that are either obviously wrong or that have no supporting evidence. I bring this up now because it looks like the 25,000-tonne figure that was plucked out of the air by Mr. Macleod last year is on its way to becoming an accepted fact in some quarters. For example, it forms the basis of a new estimate that China’s government now has 30,000 tonnes of gold.

Here’s the supply/demand table from Mr. Macleod’s article. The top section of the table purports to show the total amount of gold supply that was created during 1983-2002 and the bottom part of the table shows guesses on how this supply was distributed around the world. If the top section contains figures that are either based on false logic or completely lacking in evidentiary support, which is definitely the case, then the figures in the bottom section are irrelevant. That’s because the figures in the bottom section have been chosen so that they add up to the figures in the top section.

Gold Supply 31102014.jpg

The most obvious error is the assumption that because gold was in a secular bearish trend during 1983-2002, there was no net buying of gold within the Western world over this entire period. Instead, it is assumed that not a single ounce of the 42,000 tonnes of gold that was produced by the global mining industry during this period was bought by anyone in Europe or North America. It is also assumed that the “West” reduced its collective gold holdings by 15,000 tonnes during the period.

This takes me back to a point I’ve made many times in the past in relation to similar misguided analyses of the gold market. The point is that the quantity of gold (or anything else, for that matter) transferred from sellers to buyers says nothing about price. The corollary is that price says nothing about how much was transferred.

The fact that the price of gold was making lower-highs and lower-lows during 1983-2002 does not imply that less gold was bought in the “West”. In fact, it’s just as likely that the opposite was the case — that sellers, including gold miners, had to lower their asking prices to account for the reduced eagerness to own gold and sell what they wanted to sell. It’s therefore quite possible that there was no net “Western” divestment of gold and that all of the gold produced during 1983-2002 was sold in the “West”.

I’m not claiming that all of the gold produced by the mining industry during 1983-2002 was sold to Western buyers, but such a claim would be no more ridiculous than Mr. Macleod’s guess that none of the newly mined gold was sold to Western buyers.

I’ll end this discussion by reiterating that even if you have enough information to do the additions accurately (which nobody ever will, by the way), there is no point adding up the amounts of gold being transferred between sellers and buyers in different geographical regions or different parts of the market. At least, there’s no point if explanations of past price movements and clues regarding future price movements are what you want. There could, however, be a point if your aim is to find a justification for being bullish no matter what’s happening in the world.

I should probably do a separate blog post titled “Total guesswork regarding China’s gold strategy”.

Print This Post Print This Post

Looking for (gold price) clues in all the wrong places

Every transaction in a market involves an increase in demand for the traded item on the part of the buyer and an exactly offsetting decrease in the demand for the traded item on the part of the seller, which means that neither a purchase nor a sale implies a market-wide change in demand or price. This is obvious, so why does so much gold-market analysis focus on the quantities of gold shifting from one geographical area to another or from one part of the market to another?

I don’t know the answer to the above question, but I do know that focusing on the changes in gold location is pointless if your goal is to find clues regarding gold’s prospects. For example, while there could be a reason for wanting to know the amount of gold being transferred to China (I can’t think of a reason, but maybe there is one), the information will tell you nothing about the past or the likely future performance of the gold price. For another example, the amount of gold shifting into or out of ETF inventories could be of interest, but the shift in location from an ETF inventory to somewhere else or from somewhere else to an ETF inventory is not a driver of the gold price (as I explained in a previous blog post, changes in ETF inventory are effects, not causes, of the price trend).

Over recent years many gold bulls have cited the net-buying of gold by the geographical region known as China as a reason to expect higher prices. Prior to that it was often the net buying of gold by India that was cited as a reason to be bullish. The point that is being missed in such arguments is that regardless of whether gold’s price trend is bullish or bearish, some parts of the world will always be net buyers and other parts of the world will always be net sellers of gold, with the two exactly offsetting each other. At some future time it is possible that China will become a net seller and the US will become a net buyer. If so, will the same pundits that have wrongly cited the buying of China as a reason to be bullish then start wrongly citing the buying of the US as a reason to be bullish? Unfortunately, they probably will.

What determines gold’s price trend isn’t the amount of gold bought, since the amount bought will always equal the amount sold. Instead, the price trend is determined by the general urgency to sell relative to the general urgency to buy (with the relative urgency to buy/sell being strongly influenced by confidence in the two senior central banks). To put it another way, if the average buyer is more motivated than the average seller, the price will rise, and if the average seller is more motivated than the average buyer, the price will fall. So, how do we know whether the buyers or the sellers are the more motivated group?

The only reliable indication is the price itself. If the price is rising we know, with 100% certainty, that buyers are generally more motivated than sellers. In other words, we know that demand is trying to increase relative to supply. And if the price is falling we know, with 100% certainty, that sellers are generally more motivated than buyers. In other words, we know that demand is trying to decrease relative to supply.

That’s why statements along the lines of “demand is rising even though the price is falling” are just plain silly.

Print This Post Print This Post

Tell me, again, how the end of the Fed’s QE program will be bearish for gold

This post is a reiteration of the points I made in my 16th December article and includes updated charts. The main point is that there are times, like now, when less ‘accommodative’ monetary policy is absolutely not bearish for gold.

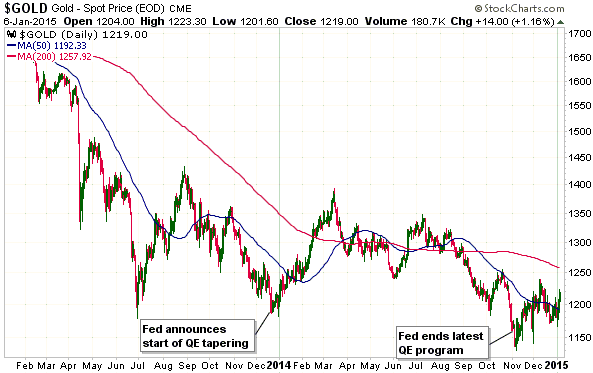
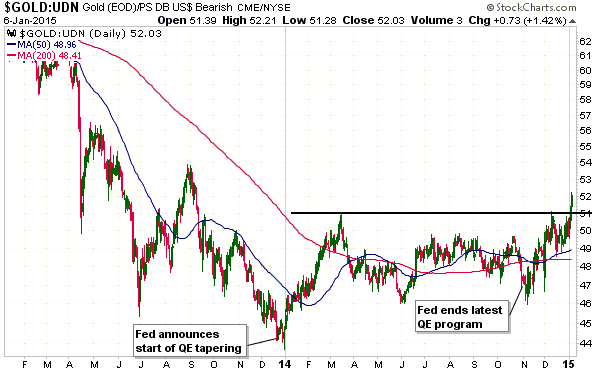
The Fed announced the beginning of its QE “tapering” on 18th December 2013. The following charts show that within a few days of this announcement gold made a major bottom in non-US$ terms (the gold/UDN ratio is a proxy for gold’s performance in terms of a basket of important currencies excluding the US$) and an intermediate-term bottom in US$ terms.

The Fed then methodically “tapered” its QE program during 2014 and announced the completion of the program on 29th October. The following charts also show that within a few days of this announcement gold bottomed in both non-US$ terms and US$ terms.

Over the past two days gold broke out to the upside in non-US$ terms and appears to have completed a long-term base.

gold_060115

gold_UDN_060115

As I explained in the above-linked article, the critical point to understand is that gold’s perceived value moves in the opposite direction to confidence in central banking and the economy. During periods when a general belief takes hold that the central bank’s money-pumping is improving the economy’s prospects, the money-pumping turns out to be an intermediate-term bearish influence on the gold market. However, the money-pumping distorts the economy in a way that eventually leads to substantial economic weakness.

A tightening of monetary conditions will begin to reveal the distortions (mal-investments) caused by the preceding ‘monetary accommodation’, which is why the demand for gold will sometimes increase as the Fed becomes more restrictive. In such a situation gold isn’t gaining ground because the Fed is tightening, it is gaining ground because tighter monetary conditions are shining a light on the economic damage caused by the earlier money-pumping.

In simpler terms, gold gets hurt by the boom and helped by the bust, so anything that perpetuates the boom is bearish for gold and anything that helps bring on the bust that inevitably follows an inflation-fueled boom is bullish for gold.

Print This Post Print This Post

The “gold backwardation” (a.k.a. negative GOFO) storm in a teacup

This blog post is a slightly modified excerpt from a recent TSI commentary.

Back in July of last year I pointed out that in a world where official short-term interest rates are close to zero, some short-term market interest rates are also going to be very close to zero, and that, in such cases, interest-rate dips below zero could occur as a result of insignificant price fluctuations. A topical example at the time was “gold backwardation”, meaning the price of gold for immediate delivery moving above the price of gold for future delivery. Gold backwardation is still a topical example and, thanks to the persistence of near-zero official US$ interest rates, is still not significant. What I mean is that the “backwardation” has almost everything to do with the near-zero official short-term interest rate and almost nothing to do with gold supply/demand. So please, gold analysts, stop pretending otherwise!

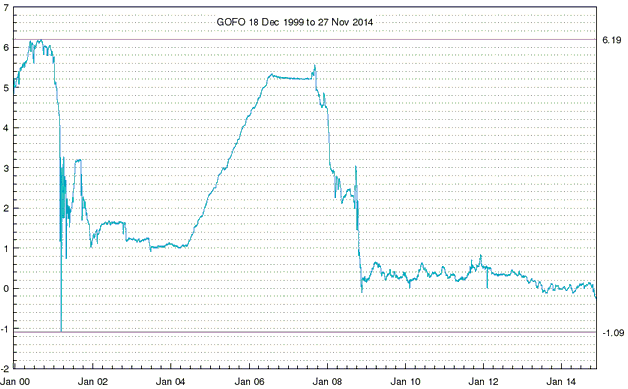
When the gold market is in backwardation, something called the Gold Forward Offered Rate (GOFO) will be negative. A negative GOFO effectively just means that it costs more for a major bank to borrow gold than to borrow US dollars for a short period. In a situation where the relevant short-term US$ interest rate (LIBOR) is close to zero, why would this be important or in any way strange?

The answer is that it wouldn’t be. What’s strange is an official US$ interest rate pegged near zero. Given this US$ interest rate situation, it is not at all surprising or meaningful that the GOFO periodically dips into negative territory and the gold market slips into “backwardation”.

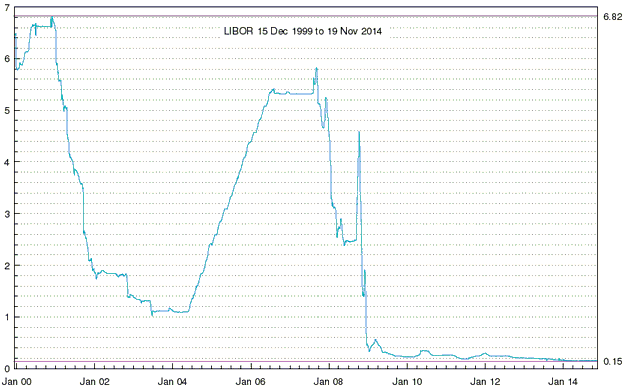
The charts displayed below illustrate the point I’m attempting to make. The first chart shows the 1-month GOFO and the second chart shows the 1-month LIBOR. Notice that apart from a couple of spikes in one that don’t appear in the other, these charts are essentially identical. The message is that GOFO generally tracks LIBOR, so with the Fed having effectively pegged LIBOR near zero since late-2008 it would be normal for GOFO to fluctuate around zero and to sometimes be negative.

The upshot is that a negative GOFO (and, therefore, a “backwardated” gold market) would be a meaningful signal if LIBOR were at a more normal level (say, 3%), but with LIBOR near zero it should be expected that GOFO will periodically move below zero. In other words, there won’t be a useful signal from GOFO until official US$ interest rates move up to more normal — or at least up to less abnormal — levels.

Before ending this post, here are two related points on gold-linked interest rates:

First, the Gold Lease Rate (GLR) that you see quoted in various places is equal to LIBOR minus GOFO. It is a derived quantity and not the actual amount that is paid to borrow gold. The actual amount that any gold borrower pays in interest will be negotiated on a case-by-case basis with the gold lender and will NEVER be negative. In other words, although the derived GLR will sometimes go into negative territory, this doesn’t mean that people are being paid to borrow gold.

Second, a lower GOFO implies a higher (not lower) cost to borrow gold. GOFO’s recent dip into negative territory therefore implies that the cost to borrow gold has risen, although the percentage changes have been tiny and, as noted above, the lease rate paid by a specific borrower will generally not be the same as the GLR published by the LBMA and charted at web sites such as Kitco.com.

Print This Post Print This Post

Revisiting the Goldman Sachs $1050/oz gold forecast

This blog post is a slightly-modified excerpt from a recent TSI commentary.

At the beginning of this year, banking behemoth Goldman Sachs (GS) called for gold to end the year at around $1050/oz. I didn’t agree with this forecast at the time and still believe it to be an unlikely outcome (although less unlikely than it was a few months ago), but earlier this year I gave Goldman Sachs credit for at least looking in the right direction for clues as to what would happen to the gold price. In this respect the GS analysis was/is vastly superior to the analysis coming from many gold-bullish commentators.

Here’s what I wrote at TSI when dealing with this topic back in April:

GS’s analysis is superior to that of many gold bulls because it is focused on a genuine fundamental driver. While many gold-bullish analysts kid themselves that they can measure changes in demand and predict prices by adding up trading volumes and comparing one volume (e.g. the amount of gold being imported by China) to another volume (e.g. the amount of gold being sold by the mining industry), the GS analysts are considering the likely future performance of the US economy.

The GS bearish argument goes like this: Real US economic growth will accelerate over the next few quarters, while interest rates rise and inflation expectations remain low. If this happens, gold’s bear market will continue.

The logic in the above paragraph is flawless. If real US economic growth actually does accelerate over the next few quarters then a bearish view on the US$ gold price will turn out to be correct, almost regardless of what happens elsewhere in the world. The reason the GS outlook is probably going to be wrong is that the premise is wrong. Specifically, the US economy is more likely to be moribund than strong over the next few quarters. It’s a good bet that inflation expectations will remain low throughout this year, but real yields offered by US Treasuries are more likely to decline than rise due to signs of economic weakness and an increase in the popularity of ‘safe havens’ as the stock market trends downward.

I was right and GS was wrong about interest rates, in that both nominal and real US interest rates are lower today than they were in April. However, it is certainly fair to say that GS’s overall outlook as it pertains to the gold market has been closer to the mark than mine over the intervening period. This is primarily because economic confidence has risen, which is largely due to the continuing rise in the senior US stock indices.

So, regardless of whether or not gold ends up getting closer to GS’s $1050/oz target before year-end (I don’t think it will), I give GS credit for being mostly right for mostly the right reasons over the course of this year to date.

For their part, many gold bulls continue to look in the wrong direction for clues as to what the future holds in store. In particular, they continue to fixate on trading volumes, seemingly oblivious to the fact that for every net-buyer there is a net-seller and that the change in price is the only reliable indicator of whether the buyers or the sellers are the more motivated.

Print This Post Print This Post

Most gold market analysts don’t understand the most basic law of economics

I start reading a lot more articles about gold than I finish reading. This is because as soon as I read something in an article that reveals a very basic misunderstanding about the gold market, I stop reading. Sometimes I don’t even get past the first paragraph. Life is too short and there is so much to read that I refuse to waste time reading the words of someone who has just demonstrated cluelessness on the topic at hand. Here are some of the ‘red flag’ statements and arguments in a gold-related article that would stop me in my tracks.

1) Treating annual gold mine production as if it were a large part of the supply side of the equation.

In other metals markets it can make sense to treat new mine supply as if it were a proxy for total supply, but in the gold market the mining industry’s annual production is roughly equivalent to only 1.5% of total supply (see my earlier post on this topic). Therefore, as soon as an article starts comparing the amount of gold bought by a country or market segment with the mining industry’s annual production, as if the mining industry’s production was the main way in which gold demand could be satisfied, I stop reading.

2) Misunderstanding the relationship between supply, demand and price.

Many gold-market analyses are unwittingly based on the premise that the law of supply and demand doesn’t apply to gold. What I mean is that a lot of what passes for analysis in the gold market contains comments to the effect that the demand for physical gold rose relative to supply during a period even though the price fell during that period. I stop reading as soon as I see a comment along these lines. The author of the article may as well have held up a big sign that says: “You’re wasting your time reading this because I’m completely clueless”.

The falling price in parallel with rising demand scenario favoured by too many gold-market commentators is absolutely, unequivocally, impossible. If demand is attempting to rise relative to supply, then the price MUST rise. Note that I say “attempting” to rise, because, in a market that is able to clear (such as the gold market), supply and demand will always be the same, with the price changing to whatever it needs to be to maintain the balance. Furthermore, the change in price is the only way to tell whether demand is attempting to rise relative to supply or whether supply is attempting to rise relative to demand. If the price falls over a period then it is an irrefutable fact that demand attempted to fall relative to supply during that period.

On a related matter, many people fall into the trap of confusing trading volume with demand. However, trading volume generally doesn’t imply anything about demand or price.

A change in volume is never an explanation for a price change and is never an indication of whether demand is attempting to rise or fall relative to supply. The reason is that every transaction involves an increase in demand on the part of the buyer and an exactly offsetting decrease in demand on the part of the seller.

3) The selling of “paper gold” explains how the price of physical gold can fall in parallel with surging demand for physical gold.

No, it doesn’t; an increase in the demand for physical gold cannot be satisfied by an increase in the supply of “paper gold”. Regardless of what is happening in the so-called “paper” markets (e.g., the futures market), if the demand for physical gold attempts to rise relative to the supply of physical gold then the price of physical gold will rise to maintain the balance.

Now, you could reasonably argue that the goings-on in the “paper” markets affect the physical market in such a way that the holders of physical gold offer their gold for sale at lower prices than would otherwise have been the case, but this is very different from arguing that the price fell while demand increased relative to supply. For anyone who cares about logic and who understands the most basic law of economics, the latter argument is nonsense.

4) Adding up the flows of gold between different geographic regions or between different parts of the market as if the resultant information could explain past price movements and predict future price movements.

This is a corollary to item 2). It involves making the mistake of treating trading volume as a fundamental driver of price. In popular gold market analyses, this mistake most often manifests itself as treating the flow of gold into China as if it were a hugely bullish fundamental.

Think of the gold world as containing only two traders called China and World-Excluding-China (WEC). If WEC becomes a net seller of gold, then China must become a net buyer of gold to the same extent. The question is: How far will the price have to fall before China is prepared to buy all the gold that WEC wants to sell or WEC’s desire to sell is sufficiently reduced to restore balance? By the same token, if WEC becomes a net buyer of gold, then China must become a net seller of gold to the same extent. The question then becomes: How far will the price have to rise before China is prepared to sell all the gold that WEC wants to buy or WEC’s desire to buy is sufficiently reduced to restore balance?

The answers to such questions are never known ahead of time. In any case, the point is that flows of gold from one part of the world to another convey little or no information about price, so why do so many gold-market analysts fixate on them?

5) Presenting intra-day price charts showing sharp ‘inexplicable’ declines to make the case that the gold price is being manipulated downward.

This counts as misinformation by omission, as even during a downward trend there will be roughly as many sudden and ‘inexplicable’ intra-day price rises as there are price declines. This has been demonstrated by “Kid Dynamite” HERE and in the related articles at the bottom of the linked post. (Note: In case it isn’t obvious, Kid Dynamite is not attempting to show that the gold price is being manipulated upward. With tongue firmly planted in cheek, he is attempting to show that similar ‘evidence’ used to support the downward manipulation case can be used to support an upward manipulation case.)

You should ask yourself why some bloggers and newsletter writers only show you the intra-day downward spikes. Are they unaware of the upward spikes, or are they trying to mislead you?

Print This Post Print This Post

Annual gold-mine supply is just 1.5% of total gold supply

One of my readers sent me the following two-paragraph excerpt — written by someone called “Bill H” about a debate between Chris Powell and Doug Casey at a recent conference — from a commentary at lemetropolecafe.com, a web site dedicated to the idea that downward price manipulation dominates the gold market. He asked me to comment on the second paragraph, but I’ll do better than that — I’ll comment on both paragraphs. I’ll explain why the first paragraph contains a misunderstanding about economics and why the second paragraph reveals extreme ignorance of the gold market. First, here’s the excerpt:

Powell also pointed to Larry Summer’s Gibson paradox study where low gold prices also aid in low interest rates and allow for more debt and currency issuance than would otherwise be the case. He also pointed to documents from the CME that shed light on the fact the central banks are “customers” and actually receive volume discounts for trading. Chris then mentioned that just because gold has gone higher, this is not evidence of no suppression as gold would or could be much higher in price if it were not for suppression. In answer to Casey’s statement “we would never suppress the prices of gold and silver because this would aid the Chinese and Russians”, insider Jim Rickards claims a “deal” has been struck with the Chinese.

I have no proof of this one way or the other but it does make perfect sense to me. I could write an entire piece on this subject but for now a paragraph will have to suffice. If China (and India) are buying more than the entire year’s global production of gold …yet the price has been dropping during this operation …the metal HAS to be coming from somewhere. The ONLY “somewhere” this can be is from where it is (has) being stored, central bank vaults. The only possible way for prices to not rise when physical demand grossly exceeds supply is through the use of paper derivatives. It is really just this simple. In my opinion what Jim Rickards has said must have some truth behind it, some sort of deal has to have been struck which allows China/India (and Russia) to purchase increasing amounts of gold at decreasing prices. As I have said all along, once China cannot receive gold in exchange for dollars …then of what use are their dollar holdings? Do you see? The game will be up and there will be no incentive to China whatsoever to hold any dollars which will …end the game.

The misunderstanding about economics has three parts.

First, “Gibson’s Paradox” only applies in the context of a Gold Standard. It has no relevance to the current monetary system.

Second, there is actually no paradox.

As an aside, Keynesian economists sometimes arrive at what they consider to be paradoxes, the “Paradox of Thrift” being the classic case. However, this is only because they are being guided by hopelessly flawed economic theories. For example, Keynesians get the economic growth process completely backward. They think it begins with consumer spending, when in reality it ENDS with consumer spending and begins with saving. That’s why they believe that an economy-wide increase in saving (meaning: a reduction in consumer spending in the present) is bad for the economy and must be discouraged. In the case of “Gibson’s Paradox”, which revolves around the link between interest rates and the general price level under a Gold Standard, there will only be a paradox for the economist who doesn’t understand the relationship between interest rates and time preference (the desire to spend money in the present relative to the desire to delay spending (to save, that is)).

Third, if gold were being manipulated today in accordance with the relationship between gold and interest rates that existed during the Gold Standard, then an effort to create lower interest rates would involve an effort to manipulate the price of gold UPWARD relative to the prices of most other commodities (under the Gold Standard, a decline in interest rates tended to be associated with a rise in the purchasing power of gold). Strangely, this is what happened over the past 7 years, in that the gold/commodity (gold/CCI) ratio rose as interest rates fell and reached a multi-generational high in 2012 at around the same time as interest rates on long-dated US Treasury securities reached a multi-generational low.

Now, I’m not saying that gold was manipulated upward relative to other commodities as part of an attempt to suppress interest rates. These days central banks make full use of their power to manipulate interest rates directly, thus obliterating any reliable link between the price of credit and the general desire to spend/save. Central banks have even gone a long way towards obliterating any link between the price of credit and the risk of default. In a nutshell, interest rates have been distorted to the point where they no longer provide valid signals. What I’m saying is that you need to have a sub-par understanding of economics to believe that gold has been manipulated downward as part of a scheme to create lower interest rates.

I could write a lot more about the relationships between economy-wide time preference, interest rates, the general price level and gold, but I don’t want to get bogged down and this post is already longer than originally intended. Instead, let’s move on to the second of the excerpted paragraphs.

I was particularly impressed by the following sentences:

“If China (and India) are buying more than the entire year’s global production of gold …yet the price has been dropping during this operation …the metal HAS to be coming from somewhere. The ONLY “somewhere” this can be is from where it is (has) being stored, central bank vaults. The only possible way for prices to not rise when physical demand grossly exceeds supply is through the use of paper derivatives. It is really just this simple.”

These sentences reflect a very basic misunderstanding about the gold market that I end up addressing several times every year in TSI commentaries. The fact is that the supply of gold is NOT the annual amount of gold produced by the mining industry. Rather, the mining industry adds only about 1.5% to the total supply of gold every year. This is why changes in mine production have almost no effect on gold’s price trend and why it is illogical to compare the gold demand of some countries or regions with annual mine production.

The total supply of gold is around 170,000 tonnes, and over the next 12 months the mining industry will add about 2,500 tonnes to this total supply. Furthermore, the mining industry is no different to any other seller (an ounce of gold mined over the past year is the same as an ounce of gold that has been sitting in storage for the past 200 years), except that it is price-insensitive. The mining industry will sell its 2,500 tonnes regardless of price, whereas the actions of the holders of the existing 170,000 tonnes of aboveground gold will be influenced by changes in the gold price and changes in the perceived attractivess of gold as an investment or store of value.

Some existing holders (the weak hands) are likely sellers in response to price weakness, whereas other holders are likely sellers in response to price strength. Some existing holders will change their plans based on their assessments of current and likely future conditions, whereas others will be determined to hold forever. At the same time there are a huge number of potential buyers, some of whom will be planning to buy in response to lower prices, some of whom will be likely to buy in response to signs of an upward trend reversal, and many of whom will change their plans based on changes in the financial world.

The main point to be appreciated here is that it’s the urgency to sell on the parts of existing holders of the total gold stock relative to the urgency to buy on the parts of prospective new owners that determines the change in price. As noted above, the gold mining industry is just one small piece of a very big puzzle.

Finally, I’m not going to attempt to debunk the unsubstantiated claim that the US government has made a deal with the Chinese government whereby the gold price will be held down to facilitate the latter’s gold accumulation. This is just a nonsensical story.

Print This Post Print This Post

Gold mining CEOs are generally clueless about gold

The CEOs of commodity-producing companies are usually knowledgeable about the supply of and the demand for their company’s products, but gold-mining CEOs are exceptions. The vast majority of gold-mining CEOs have almost no understanding of supply and demand in the gold market.

For example, like most gold-market analysts and commentators, most gold-mining CEOs wrongly believe that the change in annual gold production is an important driver of the gold price. In particular, they talk about “Peak Gold” as if a leveling-off or a downward trend in global gold-mine production would be very supportive for the gold price. This means that they don’t understand that the gold-mining industry’s contribution to the total supply of gold currently equates to only 1.5% per year, and, therefore, that changes in industry-wide gold production will always be dwarfed — in terms of effect on the gold price — by changes in investment/speculative demand. (And by the way, changes in investment/speculative demand cannot be quantified by looking at transaction volumes.)

Gold CEOs’ general cluelessness about the gold market is reflected by the performance of the World Gold Council (WGC). Every year, the WGC produces a pile of completely irrelevant information about gold.

Fortunately, understanding the gold market has nothing to do with being a good CEO of a gold-mining company. A good gold-mining CEO is someone who a) implements strategies that keep total costs at relatively low levels, b) prudently manages country, local-community, environmental and other political risks, c) ensures that the balance sheet remains healthy, and d) only makes acquisitions that are accretive.

Print This Post Print This Post

Steep price declines and increased buying often go together

In numerous TSI commentaries over the years I’ve written about the confusion in the minds of many analysts regarding what constitutes gold supply and the relationship between supply, demand and price in the gold market. I’ve also covered the issue several times at the TSI Blog, most recently on 24th June in the post titled “More confusion about gold demand“. I’m not going to delve into this subject matter again today other than to use the example of last Monday’s trading in GDX (Gold Miners ETF) shares to further explain a point made in the past.

On Monday 20th July the GDX price fell by about 10% on record volume of 170M shares. Since every transaction involves both a purchase and a sale, more GDX shares were bought last Monday than on any other single day in this ETF’s history. And yet, this massive increase in buying occurred in parallel with a large price decline. How could this be?

Obviously, the large price decline CAUSED the massive increase in buying. Many holders of GDX shares were eager to get out and the price had to fall as far as it did to attract sufficient new buying to restore the supply-demand balance.

It’s normal for large and fast price declines in the major financial markets to be accompanied by unusually-high trading volumes, meaning that it’s normal for large and fast price declines in the major financial markets to be accompanied by increased BUYING. Most people understand this. So why is it held up as evidence that something nefarious is happening whenever an increase in gold buying accompanies a large decline in the gold price?

I can only come up with two plausible explanations. One is that many analysts and commentators switch off their brains before pontificating about gold. The other is that the relationship between gold supply, demand and price is deliberately presented in a misleading way to promote an agenda. I suspect that the former explanation applies in most cases, meaning that in most cases there’s probably more ignorance than malice involved.

Print This Post Print This Post

Just when I thought it couldn’t get any worse…

Sorry to belabor a subject to which I’ve already devoted a lot of blog space, but just when I thought that the gold supply-demand analysis of Mineweb journalist Lawrence Williams couldn’t get any worse, he comes up with THIS. Not satisfied with wrongly portraying, in many articles, the shift of gold from outside to inside China as an extremely bullish price-driving fundamental and representative of an increase in global gold demand, he now wants you to believe that the transfer of gold from one China-based trader to another China-based trader constitutes an increase in overall Chinese gold demand. No, I’m not making that up. Read the above-linked article.

What he is specifically claiming is that an increase in overall Chinese gold demand occurs when someone in China takes delivery of gold from the Shanghai Gold Exchange (SGE). He seems to be oblivious of the fact that all the gold sitting in the SGE’s inventory is owned by someone, so in order for Trader Wong to satisfy an increase in his demand for physical gold by taking delivery, Trader Chang, the current owner of the gold held in the SGE inventory, must reduce his demand for physical gold by exactly the same amount. There can be no net change in demand as a result of such a transaction, and, as discussed in previous posts, the price effect will be determined by whether the buyer (Wong) or the seller (Chang) is the more motivated.

Mr. Williams then goes on to say:

…withdrawals from the [Shanghai Gold] Exchange for the first 3 weeks of the year have come to over 200 tonnes — and with total global new mined gold production running at around 60 tonnes a week according to the latest GFMS estimates, this shows that the SGE on its own is accounting for comfortably more than this so far this year. GFMS has also seen a fall in global scrap supplies — the other main contributor to the total world gold supply — which it sees as continuing through 2015 so the Chinese SGE withdrawal figures so far are, on their own, accounting for around 85% of ALL new gold available to the market. So where’s the rest of the world’s (including India) gold supply coming from?

The answer is that the gold could be coming from almost anywhere. Furthermore, it’s quite likely that most of the gold that ‘flows’ into China and India does not come from the current year’s mine production.

Would someone please point out to Mr. Williams that gold mined 200 years ago is just as capable of satisfying today’s demand as gold mined last month, and that the total aboveground gold inventory is at least 170,000 tonnes and possibly as much as 200,000 tonnes. This aboveground gold inventory, not the 60 tonnes/week of new mine production, is the supply side of the equation.

Print This Post Print This Post

When will the next US recession begin?

[This blog post is an excerpt from a TSI commentary published last week]

Our view for the past 11-12 months has been that last year’s US recession ended in June plus/minus one month, making it the shortest recession in US history. The latest leading economic data indicate that the recovery is intact and that the strong GDP growth reported for the first quarter of this year will continue.

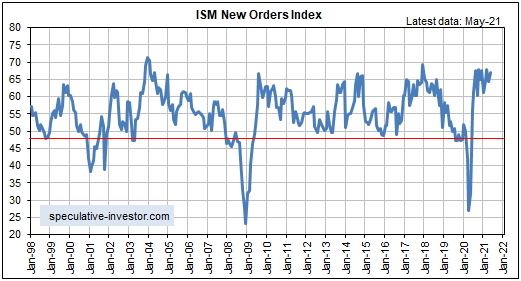
Of particular relevance, the following monthly chart shows that the ISM New Orders Index (NOI), one of our favourite leading economic indicators, remains near the top of its 20-year range. The ISM NOI leads Industrial Production by 3-6 months.

The performances of leading and coincident economic indicators show that the US economy remains in the boom phase of the boom-bust cycle, meaning that the economic landscape remains bullish for industrial commodities relative to gold. Therefore, the small amount of relative strength demonstrated by gold over the past two months is probably part of a countertrend move that will run its course within the next three months.

A year ago our view was that there would be a strong rebound in economic activity fueled by monetary stimulus, fiscal stimulus and the release of pent-up demand after COVID-related restrictions were removed, but that the rebound would be short-lived. Specifically, we were looking for the US economy to recover rapidly during the second half of 2020, level off during the first half of 2021 and return to recession territory by the first half of 2022. This view was revised in response to leading indicators and by October of last year we were expecting the period of strong growth to extend through the first half of 2021.

Based again on leading indicators, we now expect the period of above-average GDP growth to continue throughout 2021, albeit with a slower growth rate during the second half than during the first half. Furthermore, the probability of the US economy re-entering recession territory as soon as the first half of 2022 is now extremely low. To get a recession within the next 12 months there will have to be another shock of similar magnitude to the virus-related lockdowns of 2020.

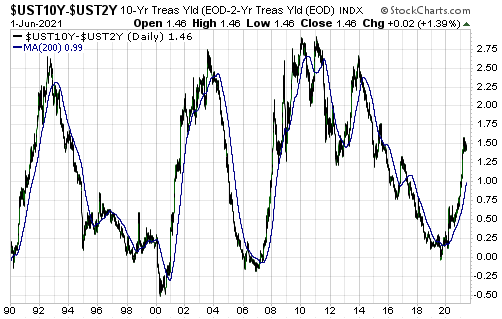
As far as what happens beyond the first half of next year, it’s largely pointless trying to look that far ahead. One thing we can say is that the current position of the yield curve suggests that the next US recession will not begin earlier than 2023. To further explain this comment we will make use of the following chart of the US 10yr-2yr yield spread, a good proxy for the US yield curve.

A major yield-curve trend reversal from flattening (indicated by a falling line on the chart) to steepening (indicated by a rising line on the chart) generally occurs during the 6-month period prior to the start of a recession. After that, what tends to happen is:

a) The yield curve steepens throughout the recession and for 1-2 years after the recession is over.

b) The yield curve peaks and a long (3-year +) period of curve flattening gets underway.

c) The curve eventually gets as flat as it is going to get and reverses direction, warning that a recession will begin within the ensuing 6 months.

Currently, there is a lot of scope for curve steepening prior to peak ‘steepness’. To be more specific, right now the 10-year T-Note yield is about 1.5% above the 2-year T-Note yield, but previous periods of curve steepening didn’t end until the 10-year T-Note yield was at least 2.5% above the 2-year T-Note yield. Moreover, history tells us that there will be a multi-year period of curve flattening between the peak in yield-curve steepness and the start of a recession.

We expect that the current economic cycle will be compressed, but it still could take years for the yield curve to return to the position where it is warning of recession.

Due to unprecedented manipulation of interest rates it could be different this time, meaning that the end of the current boom could coincide with a yield curve that contrasts with the typical pre-recession picture. However, regardless of what happens to the yield curve near the end of the current boom there will be timely warnings of a boom-to-bust transition in the real-time data, including an upward reversal in credit spreads. At the moment, such warnings are conspicuous by their absence.

Print This Post Print This Post
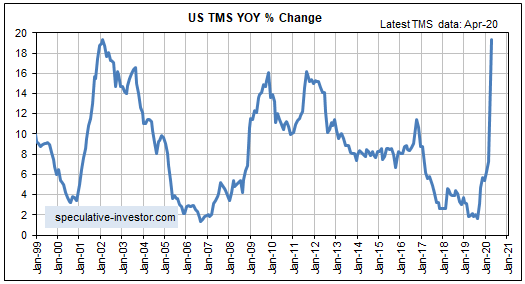
The monetary inflation moonshot

[This blog post is a modified excerpt from a recent TSI commentary]

At around this time last month we noted that the Fed had pushed the year-over-year rate of growth in US True Money Supply (TMS)*, also known as the US monetary inflation rate, to a multi-year high of 11.3%, and that based on what the Fed subsequently had done the monetary inflation rate could reach 15%-20% by the middle of this year. With the monthly monetary data for April having been published last week, we now know that the aforementioned range has been reached already. As illustrated below, as at the end of April the US monetary inflation rate was close to 20%. Next month’s rate should be even higher.

This is banana-republic-style money creation, although it isn’t unprecedented for the US. The above chart shows that a near-20% monetary inflation rate also was attained in January-2002. Back then it was the bursting of the stock market bubble followed by the 9/11 attacks that caused the Fed to panic and flood the financial system with new money.

In a way, the shock to the financial markets resulting from the attacks by terrorists in September-2001 is similar to the shock to the financial markets resulting from the COVID-19 lockdowns. That’s despite the huge differences in the economic ramifications (the damage inflicted on the overall economy by the 9/11 attacks was minor and short-term, whereas the damage inflicted on the overall economy by the virus-related lockdowns of 2020 will prove to be major on both a short-term basis and a long-term basis).

The similar reactions of the financial markets (most notably the stock market) to the events of 2001 and 2020 firstly can be put down to the fact that both situations involved a sudden increase in uncertainty. Investors and speculators knew that the world had changed for the worse, but were ‘in the dark’ regarding many of the details. Secondly, in both cases there was an immediate and aggressive attempt by policy-makers to ‘reflate’.

Some of the results of this year’s monetary inflation moonshot should be similar to the results of the 2001 episode. In particular, this year’s explosion in the supply of US dollars should lead to a weaker US$ on the foreign exchange market (the Dollar Index commenced a multi-year bearish trend in January-2002 and probably will do the same within the next few months), a higher gold price, higher commodity prices and — eventually — higher equity prices.

The most important difference is that over the years ahead the economy will stay weak and, as a result, the unemployment rate will stay high. This is because flooding the economy with new dollars not only does nothing to make up for the destruction of real wealth caused by the lockdowns, it gets in the way of wealth creation by falsifying price signals and keeping ‘zombie companies’ alive.

*TMS is the sum of currency in circulation, demand deposits and savings deposits. It does not include bank reserves, time deposits or money market funds.

Print This Post Print This Post

Sometimes it actually is different

In a TSI commentary last November I wrote about adjustments I was making to my stock selection process. These adjustments weren’t due to issues with any individual stock(s) or the performance of any individual stock-market sector. In particular, the poor performance of the average junior gold-mining stock during 2019′s gold rally wasn’t the primary driver of my decision to make some changes, although it was the proverbial “last straw”. The primary basis for my adjustment was evidence that the investing landscape had changed in a permanent, or at least a semi-permanent, way.

Long-term changes in the investing landscape happen from time to time, that is, the future is not always a simple extrapolation of the past. This occurs not because of a change in human nature (human nature never changes), but because of a change in the monetary system. For example, the investment strategy that involved shifting from equities to bonds when the stock market’s average dividend yield dropped below the average yield on investment-grade bonds worked without fail for generations prior to the mid-1950s, but from the mid-1950s onward it didn’t work. The reason this ‘fail safe’ approach to asset allocation stopped working was the increasing propensity/ability of central banks to inflate the money supply.

As part of their attempts to encourage more borrowing and consumption, over the past few years the major central banks manipulated interest rates down to unprecedented levels. Ten years ago very few people thought that negative nominal interest rates were possible, but in 2019 we reached the point where 1) a substantial portion of the developed-world’s government debt was trading with a negative yield to maturity, 2) some corporate bonds had negative yields to maturity, and 3) banks in some European countries were offering mortgages with negative interest rates.

Due to the draconian efforts of central banks to promote more spending and borrowing, it’s possible that the public is now effectively ‘tapped out’. This would explain why the quantity of margin debt collapsed over the past 18 months relative to the size of the US stock market, something that NEVER happened before with the S&P500 in a long-term bullish trend and regularly making new all-time highs. Also, it would explain why the average small-cap stock (as represented by the Russell2000) is trading at a 16-year low relative to the average large-cap stock (as represented by the S&P500).

Linked to the relatively poor performance of the average small-cap stock is the increasing popularity of passive investing via indexes and ETFs. Over the past several years there has been a general decline in the amount of active, value-oriented stock selection and a general rise in the use of ETFs. This has caused the stocks that are significant components of popular ETFs to outperform the stocks that are not subject to meaningful ETF-related demand, regardless of relative value. There is no reason to expect this trend to end anytime soon. On the contrary, the general shift away from individual stock selection and towards the use of ETFs appears to be accelerating.

At this stage I’m not making dramatic changes to my stock selection approach. I will continue to follow speculative small-cap stocks, but my selection process will be more risk averse and I will reduce the potential tracking error during intermediate-term rallies in mining stocks by putting more emphasis on ETFs and mutual funds. Also, when making future speculative mining-stock selections I will pay greater heed to the attractiveness of the assets to large mining companies. The reason is that regardless of the public’s willingness to speculate, large mining companies will always be under pressure to replace their depleted reserves and add new reserves. The easiest way for large companies to do this is to buy small companies that have discovered mineral deposits of sufficient size and quality.

In summary, as a result of unprecedented manipulation of money and interest rates it’s possible that some of the investing/speculating strategies that worked reliably in the past will not work for the foreseeable future. I think it makes sense to adapt accordingly.

Print This Post Print This Post

Why a euro collapse will precede a US$ collapse

The euro may well gain in value relative to the US$ over the next 12 months, but three differences between the monetary systems of the US and the euro-zone guarantee that the euro will collapse (cease being a useful medium of exchange) before the US$ collapses.

The first difference is to do with the euro-zone system being an attempt to impose common monetary policy across economically and politically disparate countries. This is a problem. A central planning agency imposing monetary policy within a single country is bad enough because it generates false price signals and in so doing reduces the rate of economic progress. However, when monetary policy (the combination of interest-rate and money-supply manipulations) is implemented across several economically-diverse countries the resulting imbalances grow and become troublesome more quickly.

As an aside, money is supposed to be a medium of exchange and a yardstick, not a tool for economic manipulation. Therefore, it is inherently no more problematic for different countries to use a common currency than it is for different countries to use common measures of length or weight. On the contrary, a common currency makes international trading and investing more efficient. For example, there were long periods in the past when gold was used simultaneously and successfully as money by many different countries. However, if a currency can be created out of nothing then there is no getting around the requirement to have an institution that oversees/manages it. The euro therefore could not be ‘fixed’ by simply eliminating the ECB. The ECB and the one-size-fits-all monetary policy it imposes are indispensable parts of the euro-zone system.

The second difference is linked to the concept that a government with a captive central bank cannot become insolvent with respect to obligations in its own currency. For example, due to the existence of the Fed the US government will always have access to as much money as it needs to meet its obligations, regardless of how much debt it racks up. Putting it another way, should all other demand for Treasury debt disappear the Fed will still be there to monetise whatever amount of debt the US government issues. Consequently, the US government will never be forced to directly default on its debt.

It’s a different story in the euro-zone, however, because the ECB is not beholden to any one government. The provision of ECB financial support to one euro-zone government therefore requires the acquiescence of other governments. This hasn’t been a stumbling block to date and the ECB has provided whatever support was needed to prevent financially-stressed euro-zone governments from directly defaulting on their debts, but eventually a point will be reached when the governments of some countries balk at their interest rates and money being distorted as part of an effort to prop-up the finances of other governments. At that point there will be direct default on euro-zone government debt or the disintegration of the monetary union.

Once it becomes clear that direct default on government debt is a risk to be reckoned with, ‘capital’ will flee the euro-zone at a rapid rate. This is because the main (only?) reason to own government bonds is that they are supposedly risk free.

The third critical difference between the US and euro-zone monetary systems is similar to the second difference. In the US there is a symbiotic relationship between the Fed and the government, with one institution always prepared to support the other in a time of crisis. One consequence of this relationship is the impossibility — as discussed above — of the US government ever being forced to directly default on its debt. Another consequence is the impossibility of the Fed ever becoming bankrupt.

Several years ago there was much speculation that the Fed would go broke due to large losses on the bonds it was buying in its QE operations, but this speculation was never well-informed. Up until now the Fed has made out like the bandit it is on its ‘investments’ in Treasury and mortgage-backed securities, but even if these securities had collapsed in value it would not have resulted in the Fed going bust. It simply would have led to a line being added to the Fed’s balance sheet to keep the books in balance.

Again, though, it’s a different story in the euro-zone. Should the ECB begin to incur large losses on its bond portfolio there is no certainty that it would be able to keep going about its business as usual. To do so would require the support of governments/countries that never benefited from and never whole-heartedly agreed with the programs that led to the pile-up of low-quality bonds on the ECB’s balance sheet.

Summing up, the US monetary system is problematic in that it gets in the way of economic progress, but it is much less fragile than the euro-zone monetary system. That’s why the euro-zone system will be the first to collapse.

Print This Post Print This Post
Misconceptions about US bank reserves

Bank reserves are a throwback to a time when the amount of receipts for money (gold) that could be issued by a bank was limited by the amount of money (gold) the bank held in reserve. Under the current monetary system bank reserves have no real meaning, since it isn’t possible for a dollar in a bank deposit to be genuinely backed by a dollar held somewhere else. The dollar can’t back itself! However, it is still important to understand what today’s bank reserves are/aren’t and how changes in the reserves quantity are linked to changes in the economy-wide money supply. Remarkably, these bank-reserve basics are misunderstood by almost everyone who comments on the topic.

The simplest way for me to deal with the common misunderstandings about bank reserves is in point form, so that’s how I’ll do it. Here goes:

1) Bank reserves aren’t money, that is, they are not considered to be general media of exchange and are not counted in the True Money Supply (TMS). Instead, they provide ‘backing’ for part of the money supply.

2) A corollary of the above is that banks can’t use their reserves to buy things outside the Federal Reserve system.

3) Banks can lend their reserves to other banks, but the banking industry as a whole cannot expand or shrink its reserves. In other words, the banking industry has no control over its collective reserves. The central bank has total control.

4) Bank reserves can be shifted around within accounts at the Fed, but the only way that reserves can leave the Fed and enter the economy is via the withdrawal, by the public, of physical currency from banks. For example, when $100 is withdrawn from an ATM, $100 is converted from deposit currency to physical currency. This doesn’t alter the money supply, but it causes the bank to lose a $100 liability (the bank customer’s deposit) and a $100 asset (the physical currency held in the bank’s vault). When the quantity of physical currency held in a bank’s vault gets too small, the bank will replenish its supply by withdrawing reserves from the Fed in the form of new paper dollars. Although it may appear that this imposes some sort of limit on the supply of physical dollars, the Fed stands ready, willing and able to meet any increase in demand. This is further discussed in point 5).

5) Under the current monetary system, reserves effectively are created out of nothing. To be more precise, the Fed creates reserves when it purchases bonds and other assets. Since there is no limit to the dollar value of assets that can be purchased by the Fed, the banking system will never run short of the reserves it needs to meet the public’s demand for physical currency. Also, the Fed can remove reserves whenever it wants by selling bonds and other assets.

6) Except for the siphoning of reserves in response to the public’s increasing demand for physical currency, it is accurate to say that reserves at the Fed stay at the Fed until they are removed by the Fed. A corollary — as already mentioned in point 3) — is that the commercial banking industry cannot draw-down its reserves.

7) The Fed pays interest on ALL reserves, not just so-called “excess reserves”. In any case and as outlined below, for all intents and purposes all US bank reserves, with the exception of the relatively small portion required to meet any increase in the demand for physical currency, are now excess and have been for the past few decades.

8) The way the US monetary system now works it is fair to say that all reserves are excess. The reason is that the quantity of bank reserves has no bearing on the amount by which banks expand/contract credit. In effect, the US now has a zero-reserve fractional reserve banking system. That’s why it was possible for the greatest expansion of bank credit in modern US history, which took place during 1990-2007, to happen while the commercial banking industry had almost no reserves. During this period total bank credit rose by $6 trillion, from $2.5T to $8.5T, while bank reserves at the Fed dwindled from $64B to $40B.

9) Further to point 8), bank lending doesn’t ‘piggy-back’ on bank reserves. It possibly did 40 years ago, but it hasn’t for at least the past 25 years. Hopefully, economics textbooks eventually will be updated to reflect this reality.

10) An implication of points 7) and 8) is that interest payments on reserves are neither an incentive nor a disincentive to bank lending. When a bank makes a loan to a customer it doesn’t lose any reserves and therefore continues to collect the same interest-on-reserves payment from the Fed.

11) The sole purpose of paying interest on reserves is to enable the Fed to hike the Fed Funds Rate during a period when the banks are inundated with reserves, without having to massively reduce the quantity of reserves. This was discussed in previous blog posts, for example HERE.

12) When the Fed was ‘quantitatively easing’ many pundits wrote that it was adding to bank reserves but not the money supply. This is wrong. When the Fed buys X$ of securities as part of a QE program it adds X$ to bank reserves AND it adds X$ to the economy-wide money supply. I previously described the process HERE.

13) By the same token, now that the Fed is ‘quantitatively tightening’ it is not just removing bank reserves. When the Fed sells X$ of securities as part of what it refers to as its balance-sheet normalisation program it removes X$ from bank reserves AND it removes X$ from the economy-wide money supply. In essence, it’s the process I described in the above-linked post (point 12) in reverse. That’s why the balance-sheet normalisation program is vastly more important, as far as monetary conditions are concerned, than the rate-hiking program.

Print This Post Print This Post
Random Predictions For 2019

[This blog post is an excerpt from a TSI commentary published about three weeks ago and covers a few general thoughts about what will happen in the financial world this year. Specific thoughts about what I expect this year from the stock, gold, bond, currency and commodity markets have also been included in TSI commentaries over the past three weeks.]

1) Early last year we predicted that the US stock market would experience greater-than-average volatility over the year ahead. This obviously happened, as there were more 2%+ single-day moves in the SPX during 2018 than in an average year.

We expect the same for this year, that is, we expect price volatility to remain elevated. The reason is that the two most likely scenarios involve abnormally-high price volatility. One of these scenarios is that a cyclical bear market began last October, and bear markets are characterised by periods of substantial weakness followed by rapid rebounds. The other scenario is that a very long-in-the-tooth cyclical bull market is about to embark on its final fling to the upside.

2) When attempting to predict when a period of economic growth will end it is futile to look more than 6-12 months into the future, because there are no leading recession indicators that can predict that far ahead with acceptable reliability. There are, however, leading indicators that can be used to determine the probability of a recession beginning within the next few quarters.

Early last year these indicators told us that a US recession would not begin during the first half of the year. They currently tell us that the US economy stands a good chance of commencing a recession this year, most likely during the second half of the year. Note, though, that if a recession does get underway this year it won’t become official until 2020, because recessions usually aren’t confirmed by the National Bureau of Economic Research until about 12 months after they start.

3) Regarding ‘cryptoassets’, at around this time last year we wrote:

…it’s a good bet that the Bitcoin bubble reached its maximum level of inflation late last year. Also, the broader bubble in cryptoassets is set to burst during the first quarter of this year.

And:

By the end of 2018 it will be apparent that the public’s enthusiasm for Bitcoin and the “alt-coins” was one of history’s great speculative manias.

This assessment looks correct.

We don’t have a strong opinion about what will happen to ‘cryptoassets’ in 2019. This is partly because there is no reasonable way to determine the fair value of these assets. For Bitcoin, for example, a price of $3,000 is no more or less sensible than a price of $30,000 or a price of $300.

Distributed ledgers can be very useful, but there should be ways to implement them without consuming a lot of resources. If so, the price of Bitcoin eventually will drop to almost zero.

A year ago we also predicted:

Despite spectacular collapses in the prices of the popular ‘cryptoassets’ during 2018, central banks including the Fed and the ECB will firm-up plans to introduce their own blockchain-based currencies. This will be driven by a desire to eliminate physical cash, the thinking being that if there is no physical money it will be more difficult for the average person to make/receive unreported payments and escape a negative interest rate.

As far as we know the major central banks didn’t firm-up plans to introduce their own blockchain-based currencies last year, but we continue to expect that they will — for the reasons mentioned above.

4) Regarding the Fed’s expected actions in 2018, early last year we wrote:

Due to rising commodity prices it’s a good bet that “price inflation” will become a higher-profile issue during the first half of 2018, prompting the Fed to move ahead with its quantitative tightening (QT) and make two more rate hikes. However, both the QT and the rate-hiking will be put on hold during the second half of the year in reaction to increasing downside volatility in the stock market.

We got the anticipated rate hikes during the first half and the increasing downside stock-market volatility during the second half of last year, but the Fed stuck to its guns. However, over the past three weeks the Fed Chairman has made it clear that the Fed will be quick to change direction if the stock market continues to decline and/or the economic numbers point to significant weakness.

For 2019 we expect one Fed rate hike, most likely in June. Also, we expect that people ‘in the know’ will explain to senior Fed members that it’s the balance-sheet reduction program (QT) that really counts, prompting the Fed to slow the pace of QT during the first half and conclude the QT program before year-end.

5) The ECB has just ended its QE program and has a tentative plan to implement its first rate hike during the third quarter of 2019. Given that nothing has been learned from the failed monetary experiments of the past few years, it’s a good bet that evidence of declining economic activity in the future will be met by the ramping-up or reintroduction of policies that failed in the past. Therefore, we predict that the ECB will not increase its targeted interest rates this year and will restart QE during the second half of the year.

6) This is not a prediction for 2019, but rather an observation that could apply for decades to come. We suspect that the age of real estate has ended.

We don’t mean that from now on it will be impossible to achieve good returns by investing in real estate, but that gone are the days when anyone could buy a house almost anywhere and likely end up with a sizable profit as long as they held for 10 years or more. From now on only astute investors will consistently make good returns from real estate, where “astute” means able to time the cyclical swings in the broad market or able to correctly anticipate future supply-demand imbalances in specific areas.

For the average person, residential property will transition from an investment to what it was prior to the 1970s: a consumer good (something bought solely for its use value).

The reason for the change is the interest-rate trend. The 3-4 decade downward trend in interest rates resulted in a 3-4 decade upward trend in housing affordability for buyers using debt-based leverage (that is, for the vast majority of buyers). There were corrections along the way, but provided that long-term interest rates continued to make lower lows there would eventually be a pool of new debt-financed buyers able to pay a much higher price.

There’s a good chance that the secular interest-rate trend reversed from down to up during 2016-2018. If so, future house buyers that don’t have good timing and/or substantial area-specific knowledge generally won’t make long-term capital gains on their residential property purchases.

Print This Post Print This Post