An update on gold’s true fundamentals

Print This Post Print This Post

An update on gold’s true fundamentals

I update gold’s true fundamentals* every week in commentaries and charts at the TSI web site, but my most recent blog post on the topic was on 20th March. At that time the fundamental backdrop was gold-bearish. What’s the current situation?

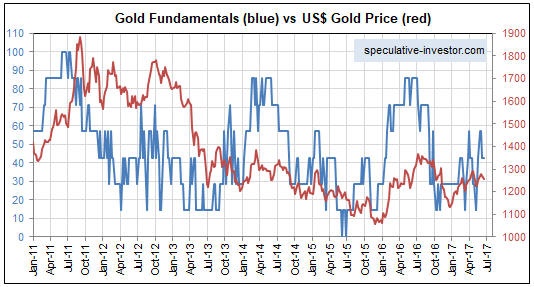
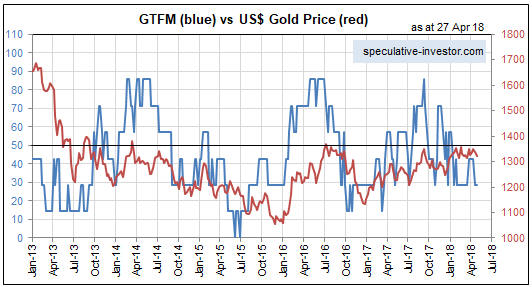
The fundamental backdrop (from gold’s perspective) is little changed since 20th March. In fact, it has not changed much since early this year. My Gold True Fundamentals Model (GTFM), a weekly chart of which is displayed below, turned bearish during the first half of January and was still bearish at the end of last week. There have been fluctuations along the way, but at no time over the past 3.5 months has the fundamental backdrop been supportive of the gold price.

GTFM_270418

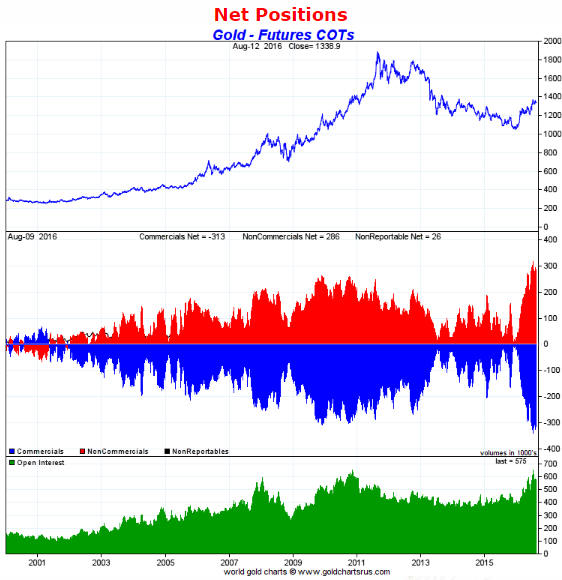
It’s possible for a tradable rally in the US$ gold price to get underway at a time when the fundamental backdrop is not gold-bullish, but for this to happen the sentiment situation as indicated by the Commitments of Traders data would have to be very supportive or the US$ would have to be very weak. Currently, the fundamental backdrop is bearish, the sentiment situation is neutral and the Dollar Index has just broken out to the upside. Therefore, as things stand today there is no good reason to expect that a substantial gold rally will get underway in the near future.

Based on how I expect the fundamentals to shift over the weeks ahead my guess is that a substantial gold rally will begin from a May-June low. However, there is more to be lost than gained by ‘jumping the gun’ and buying a short-term trading position now in anticipation of such a rally.

*Note that I use the word “true” to distinguish the actual fundamental drivers of the gold price from the drivers that are regularly cited by gold-market analysts and commentators. According to many pontificators on the gold market, gold’s fundamentals include the volume of metal flowing into the inventories of gold ETFs, China’s gold imports, the volume of gold being transferred out of the Shanghai Futures Exchange inventory, the amount of “registered” gold at the COMEX, India’s monsoon and wedding seasons, jewellery demand, the amount of gold being bought/sold by various central banks, changes in mine production and scrap supply, and wild guesses regarding JP Morgan’s exposure to gold. These aren’t true fundamental price drivers. At best, they are distractions.

Print This Post Print This Post

Gold’s 47-Year Bull Market

The following monthly chart shows that relative to a broad basket of commodities*, gold commenced a very long-term bull market (47 years and counting) in the early-1970s. It’s not a fluke that this bull market began at the same time as the final official US$-gold link was severed and the era of irredeemable free-floating fiat currency kicked off.

gold_commodity_241117

Anyone attempting to apply a traditional commodity-type analysis to the gold market would have trouble explaining the above chart. This is because throughout the ultra-long-term upward trend in the gold/commodity ratio the total supply of gold was orders of magnitude greater, relative to commercial demand, than the supply of any other commodity. Based on the sort of supply-demand analysis that routinely gets applied to other commodities, gold should have been the worst-performing commodity market.

The reason that a multi-generational upward trend in the gold/commodity ratio began in the early-1970s and is destined to continue is not that gold is money. The reality is that gold no longer satisfies a practical definition of money. The reason is the combination of the greater amount of mal-investment enabled by the post-1970 monetary system and the efforts by central bankers to dissuade people from saving in terms of the official money.

In brief, what happens is this: Central banks put downward pressure on interest rates (by creating new money) in an effort to promote economic growth, but the economy’s prospects cannot be improved by falsifying the most important price signals. Instead, the price distortions lead to clusters of ill-conceived investments, thus setting the stage for a recession or economic bust. Once it is widely realised that cash flows are going to be a lot less than previously expected there is a marked increase in the general desire to hold cash. At the same time, however, central banks say that if you hold cash then we will punish you. They don’t use those words, but it is made clear that they will do whatever it takes to prop-up prices and prevent the savers of money from earning a real return on their savings. This prompts people to look for highly liquid assets that can be held in lieu of the official money, which is where gold comes in.

This is why the gold/commodity ratio tends to trend downward when everything seems fine on the surface and rocket upward when it becomes apparent that numerous investing mistakes have been made and that the future will be nowhere near as copacetic as previously assumed.

It’s reasonable to expect that the multi-generational upward trend in the gold/commodity ratio that began in the early-1970s will continue for at least as long as the current monetary system remains in place. Why wouldn’t it?

*For the broad basket of commodity prices the chart uses the CRB Index up to 1992 and the GSCI Spot Commodity Index (GNX) thereafter.

Print This Post Print This Post

Addressing Keith Weiner’s objections to “Gold’s True Fundamentals”

A 23rd June post at the TSI Blog described the model (the Gold True Fundamentals Model – GTFM) that I developed to indicate the extent to which the fundamental backdrop is bullish for gold. The GTFM is an attempt to determine a single number that incorporates the most important fundamental drivers of the gold price, where I define “fundamental driver” as something that happens in the economy or the financial markets that causes a significant change in the desire/urgency to own gold in some form. Keith Weiner subsequently posted an article objecting to some of my “fundamental drivers”, which would be fine except that his article contains several misunderstandings of these price drivers and/or how I am using them. The purpose of this post is to address these misunderstandings and provide a little more information on the GTFM’s components.

1. The ‘Real’ Interest Rate

Keith states: “The Real Interest Rate is the Nominal Interest Rate – inflation.” No, that’s not what the real interest rate is, although many people wrongly calculate it that way.

Keith and I agree that it is not possible to calculate the economy-wide change in money purchasing-power (PP), but even if it were possible to come up with a single number that represented prior “inflation” the real interest rate would not be the nominal interest rate minus this number. The reason, to explain using an example, is that the real return that will be obtained by someone who makes a 12-month investment today in an interest-bearing security will have nothing to do with the change in the PP of money over the preceding 12 months. Instead, the real return that will be obtained by this person will be determined by the change in money PP over the ensuing 12 months.

Now, we can obviously never know in advance what the real return on any interest-bearing security or deposit will be, but since the advent of Treasury Inflation-Protected Securities (TIPS) in 2003 it has been possible to roughly determine the real return on Treasury debt expected by the average bond trader. The TIPS yield, which is based on the EXPECTED rate of currency depreciation, is my ‘real’ interest rate proxy.

If there had been a TIPS market in the 1970s then it would probably be apparent that the large gains made by the gold price during that decade were related to a low/falling real interest rate, where the real interest rate is defined as the nominal interest rate minus the expected rate of currency depreciation. In any case, there has definitely been an inverse correlation between the TIPS yield (10-year or 5-year) and the gold price over the past 10 years. Furthermore, the correlation has strengthened over the past 2 years.

By the way, it’s the DIRECTION, not the value, of the TIPS yield that matters to gold and that is taken into account by the GTFM.

The inverse relationship between the TIPS yield and the gold price is far from perfect, the reason being that there are times when other price drivers are more influential. That’s why the ‘real interest rate’ has only a one-seventh weighting in the GTFM.

2. The Yield Curve

There has never been a strong and consistent short-term correlation between the gold price and the yield curve, but near major turning points the yield curve tends to be the dominant driver.

In broad terms, the boom phase of the central-bank-promoted boom-bust cycle is generally associated with a flattening yield curve and the bust phase is generally associated with a steepening yield curve. Gold generally performs better during the bust phase, when the curve is steepening. Somewhat counterintuitively, banks tend to do best during the long periods of yield-curve flattening. This can be demonstrated empirically and makes sense if you understand how the central-bank-promoted boom-bust cycle works.

A major flattening trend in the US yield curve got underway during the second half of 2011 and continues to this day. This flattening trend is associated with a boom, which, in turn, has temporarily helped the banks and reduced the desire to own gold.

3. Credit Spreads

The trend in credit spreads is one of the best measures of the overall trend in economic confidence, with widening spreads (yields on lower-quality bonds rising relative to yields on higher-quality bonds) being indicative of declining economic confidence. Gold tends to do relatively well during periods when economic confidence is on the decline, that is, during periods when credit spreads are widening. I have demonstrated this in the past using charts.

4. The Relative Strength of the Banking Sector

Keith writes: “We haven’t plotted it, but we assume bank stocks will outperform the broader stock market when the yield curve is steeping by way of falling Fed Funds rate. This is when the banks’ net interest margin is rising, and they are getting capital gains on their bond portfolio too. At the same time, credit spreads are narrowing, so the banks are getting capital gains on their junk bonds.

No, that’s not how it works. Refer to my yield curve comments above for a very brief explanation.

The banking sector will often fare poorly during major yield-curve steepening trends because a banking crisis is often a primary cause of the steepening trend. In any case, this indicator is based on the concept that the investment demand for gold will be boosted by declining confidence in the banking system and reduced by rising confidence in the banking system.

5. The US Dollar’s Exchange Rate

More often than not, the US$ gold price trends in the opposite direction to the Dollar Index. However, there are times when a crisis outside the US causes both a rise in the US$ on the FX market and a large rise in the US$ gold price. The fact that the inverse correlation between the gold price and the Dollar Index can break down in a big way at times is why the US dollar’s performance on the FX market only has a one-seventh weighting in the GTFM. To put it another way, if the gold price always moved in the opposite direction to the Dollar Index then there would be no reason for gold traders to consider anything except the Dollar Index.

6. The General Trend in Commodity Prices

I have included the general trend in commodity prices as indicated by the S&P GSCI Commodity Index (GNX) in the GTFM for the practical reason that there are times when it tips the balance. That is, there are times when a strong upward trend in commodity prices enables the US$ gold price to rise despite an otherwise slightly-bearish (for gold) fundamental backdrop and there are times when a strong downward trend in commodity prices causes the US$ gold price to fall despite an otherwise slightly-bullish fundamental backdrop.

7. The Bond/Dollar Ratio

There are fundamental reasons for the existence of a positive correlation between the bond/dollar ratio (the T-Bond price divided by the Dollar Index) and the US$ gold price, but I currently don’t have the time or the inclination to go into these reasons. Instead, for the sake of brevity I present the following chart-based comparison of the gold price and the bond-dollar ratio. The positive correlation is obvious and is evident over much longer periods than the 3-year period covered by this chart.

gold_USBUSD_260617

I hope the above goes at least part of the way towards explaining the components of my gold model.

Print This Post Print This Post

Gold’s True Fundamentals

[This post is a modified excerpt from a TSI commentary published a few weeks ago]

To paraphrase Jim Grant, gold’s perceived value in US$ terms is the reciprocal of confidence in the Fed and/or the US economy. Consequently, what I refer to as gold’s true fundamentals are measures of confidence in the Fed and/or the US economy. I’ve been covering these fundamental drivers of the gold price in TSI commentaries for almost 17 years. It doesn’t seem that long, but time flies when you’re having fun.

Note that I use the word “true” to distinguish the actual fundamental drivers of the gold price from the drivers that are regularly cited by gold-market analysts and commentators. According to many pontificators on the gold market, gold’s fundamentals include the volume of metal flowing into the inventories of gold ETFs, China’s gold imports, the volume of gold being transferred out of the Shanghai Futures Exchange inventory, the amount of “registered” gold at the COMEX, India’s monsoon and wedding seasons, jewellery demand, the amount of gold being bought/sold by various central banks, changes in mine production and scrap supply, and wild guesses regarding JP Morgan’s exposure to gold. These aren’t true fundamental price drivers. At best, they are distractions.

In no particular order, the gold market’s six most important fundamental price drivers are the trends in 1) the real interest rate, 2) the yield curve, 3) credit spreads, 4) the relative strength of the banking sector, 5) the US dollar’s exchange rate and 6) commodity prices in general. Even though it creates some duplication, the bond/dollar ratio should also be included.

Until recently I took the above-mentioned price drivers into account to arrive at a qualitative assessment of whether the fundamental backdrop was bullish, bearish or neutral for gold. However, to remove all subjectivity and also to enable changes in the overall fundamental backdrop to be charted over time, I have developed a model that combines the above-mentioned seven influences to arrive at a number that indicates the extent to which the fundamental backdrop is gold-bullish.

Specifically, for each of the seven fundamental drivers/influences I determined the weekly moving average (MA) for which a MA crossover catches the most trend changes in timely fashion with the least number of ‘whipsaws’. It’s a trade-off, because the shorter the MA the sooner it will be crossed following a genuine trend change but the more false trend-change signals it will cause to be generated. I then assign a value of 100 or 0 to the driver depending on whether its position relative to the MA is gold-bullish or gold-bearish. For example, if the yield-curve indicator is ABOVE its pre-determined weekly MA then it will be assigned a value of 100 by the model, because being above the MA points to a steepening yield-curve trend (bullish for gold). Otherwise, it will be zero. For another example, if the real interest rate indicator is BELOW its pre-determined weekly MA then it will be assigned a value of 100 by the model, because being below the MA points to a falling real-interest-rate trend (bullish for gold). Otherwise, it will be zero.

The seven numbers, each of which is either 0 or 100, are then averaged to arrive at a single number that indicates the extent to which the fundamental backdrop is gold-bullish, with 100 indicating maximum bullishness and 0 indicating minimum bullishness (maximum bearishness). The neutral level is 50, but the model’s output will always be either above 50 (bullish) or below 50 (bearish). That’s simply a function of having an odd number of inputs.

Before showing a chart of the Gold True Fundamentals Model (GTFM) it’s worth noting that:

1) The fundamental situation should be viewed as pressure, with a bullish situation putting upward pressure on the price and a bearish situation putting downward pressure on the price. It is certainly possible for the price to move counter to the fundamental pressure for a while, although it’s extremely likely that a large price advance will coincide with the GTFM being in bullish territory most of the time and that a large price decline will coincide with the GTFM being in bearish territory most of the time.

2) The effectiveness of fundamental pressure will be strongly influenced by sentiment (as primarily indicated by the COT data) and relative valuation (as primarily indicated by the gold/commodity ratio). For example, if the fundamental backdrop is bullish and at the same time the gold/commodity ratio is high and the COT data indicate that speculators are aggressively betting on a higher gold price then it is likely that the bullish fundamental backdrop has been factored into the current price and that the remaining upside potential is minimal. The best buying opportunities therefore occur when a bullish fundamental backdrop coincides with pessimistic sentiment and a low gold/commodity ratio.

Getting down to brass tacks, here is a weekly chart comparing the GTFM with the US$ gold price since the beginning of 2011.

GTFM_blog_230617

A positive correlation between the GTFM and the gold price is apparent on the above chart, which, of course, should be the case if the GTFM is a valid model. If you look closely it should also be apparent that the fundamentals (as represented by the GTFM) tend to lead the gold price at important turning points. For example, the GTFM turned down in advance of the gold price during 2011-2012 and turned up in advance of the gold price in 2015 (the GTFM bottomed in mid-2015 whereas the gold price didn’t bottom until December-2015).

The tendency for gold to react to, rather than anticipate, changes in the fundamentals is not a new development, as evidenced by gold’s delayed reaction to a major fundamental change in the late-1970s. I’m referring to the fact that by the second half of 1978 the monetary environment had turned decisively gold-bearish, but the gold price subsequently experienced a massive rally that didn’t culminate until January-1980.

The GTFM was slightly bearish over the past two weeks, but three of the model’s seven components are close to tipping points so it wouldn’t take much from here to bring about a shift into bullish territory or a further shift into bearish territory. The former is the more likely and could occur as soon as today (23rd June).

Print This Post Print This Post

The World Gold Council’s gold market analysis is useless

A few weeks ago the World Gold Council (WGC) published its “Gold Demand Trends” report for the first quarter of 2017. These reports actually provide no information about gold demand and in my opinion are useless. In fact, they are worse than useless because they are misleading.

It is axiomatic that at any given time the total demand for gold equals the total supply of gold, which, in turn, equals the total aboveground gold inventory. The total aboveground gold inventory is somewhere between 150K and 200K tonnes, so at any given time the total demand for gold lies somewhere between 150K and 200K tonnes.

When new buyers enter the market they draw from the existing aboveground supply. These new buyers cannot possibly increase the total demand, because the increased demand on the part of people who add to their gold ownership will always be exactly offset by the decreased demand on the part of people who reduce their gold ownership.

A balance is maintained by the changing price. For example, if there are more buyers than sellers at a particular price or the buyers are more motivated than the sellers then the price will rise to establish a new balance. Therefore, a price rise is irrefutable evidence of a momentary rise in demand relative to supply and a price decline is irrefutable evidence of a momentary fall in demand relative to supply.

Importantly, the change in price is the ONLY reliable indication of an attempt by demand to rise or fall relative to supply. Any statement to the effect that a price rise was accompanied by reduced demand or that a price decline was accompanied by increased demand is therefore ludicrous.

The effect of the gold-mining industry is to increase the total aboveground gold supply by about 1.5% every year. Actually, as the result of gold mining both the total supply and the total demand increase by about 1.5% every year, since demand and supply must always be equal with price changing to maintain the balance.

Although gold miners are adding new gold to the total supply, the newly-mined gold is no more capable of satisfying current demand than gold that was mined in the distant past. Consequently, gold miners are similar to any other sellers. The one significant difference is that a gold miner will generally take whatever price is on offer, whereas most other owners of gold will have a price in mind at which they will sell (and below which they will not sell). In some cases this price will be a great distance above the current price and in other cases the owner of gold will intend to hold indefinitely regardless of how high the price rises. All of these intentions by the existing holders of gold contribute to the performance of the gold price.

Getting back to the WGC reports, what is being referred to as gold demand is actually just the sum of some easy-to-identify gold flows. In effect, these reports confuse trading volume with demand. Furthermore, they don’t even come close to accounting for all trading volume. What they essentially do is begin with the wrongheaded assumption that the total supply of gold equals the amount of annual mine production plus recycled gold plus producer hedging, or an amount of around 4,000 tonnes. They therefore begin with the assumption that the total supply of gold is about 1/50th of its actual amount. They then come up with a bunch of so-called (but not actual) demand figures, including the amount of gold moving into bullion ETFs and the amount of gold sold in jewellery form, that add up to about 4,000 tonnes.

As an aside, there will usually be a positive correlation between the gold price and the amount of gold moving into gold ETFs, but that’s only because the ETF inventory often FOLLOWS the price. I’ve discussed this in previous blog posts.

Summing up, the gold supply/demand reports put out by the WGC are based on numerous logical errors and misconceptions, such as ignoring the dominant role played by the aboveground gold stock, treating transfers from some sellers to some buyers as indicative of changing overall demand, and assuming that shifts in demand can be determined independently of price. Due to these deficiencies they are worse than useless.

Print This Post Print This Post

What should the gold/silver ratio be?

The price of gold is dominated by investment demand* to such an extent that nothing else matters as far as its price performance is concerned. Investment demand is also the most important driver of silver’s price trend, although in silver’s case industrial demand is also a factor to be reckoned with. In addition, changes in mine supply have some effect on the silver market, because unlike the situation in the gold market the annual supply of newly-mined silver is not trivial relative to the existing aboveground supply of the metal.

Given that the change in annual mine supply is irrelevant to the gold price and is not close to being the most important driver of the silver price, why do some analysts argue that the gold/silver ratio should reflect the relative rarities of the two metals in the ground and therefore be 10:1 or lower? I don’t know, but it isn’t a valid argument.

A second way of using relative rarity to come up with a very low gold/silver ratio is to assert that the price ratio should be based on the comparative amounts of aboveground supply. Depending on how the aboveground supplies are calculated, this method could lead to the conclusion that silver should be more expensive than gold. It would also lead to the conclusion that gold should be the cheapest of all the world’s commonly-traded metals, instead of the most expensive. For example, if gold’s relatively-large aboveground supply was a reason for a relatively low gold price then gold should not only be cheaper than silver, but also cheaper than copper.

Another argument is that the gold/silver ratio should be around 16:1 because that’s what it averaged for hundreds of years prior to the last hundred years. This is also not a valid argument, because changes in technology and the monetary system can cause permanent changes to occur in the relative values of different commodities and different investments. For example, when monetary inflation was constrained by the Gold Standard the stock market’s average dividend yield was always higher than the average yield on the longest-dated bonds, but the 1934-1971 phasing-out of the official link to gold permanently altered this relationship. In a world where commercial and central banks can inflate at will, the stock market will always yield less than the bond market (except when the central-bank leadership goes completely ‘off its rocker’ and implements the manipulation known as NIRP). This is because stocks have some built-in protection against inflation. The point is that the ratio of gold and silver prices during an historical period in which both metals were officially “money” does not tell us what the ratio should be now that neither metal is officially money and one of the markets (silver) has a significant industrial demand component.

The global monetary system’s current configuration dates back to the early 1970s, when the last remaining official link between gold and the US$ was severed. This probably means that we can look at how gold and silver have performed relative to each other since the early 1970s to determine what’s normal and what’s possible. With reference to the following chart, here’s a summary of what happened during this period:

a) The gold/silver ratio spent the bulk of the 1970s in the 30-40 range, but broke out of this range to the downside during the second half of 1979 in response to massive accumulation of silver bullion and silver futures by the Hunt brothers.

b) The ratio dropped as low as 16:1 in January of 1980, but then returned to 40 in the ‘blink of an eye’ as rule changes by the commodity exchange created financial problems for the highly-geared Hunts and a commodity-investment bubble began to deflate.

c) During the second half of the 1980s the ratio trended upward as US financial corporations weakened. The ratio peaked at around 100 at the beginning of 1990s in parallel with a full-blown banking crisis that almost resulted in the collapse of some of the largest US banks.

d) The ratio trended lower throughout the 1990s as the banks recovered (with the help of the Fed) and financial assets trended upward.

e) From the late 1990s through to the beginning of 2011 the ratio oscillated between 45 and 80, with 80 being reached near the peaks of financial crises (early-2003 and late-2008) and 45 being reached in response to generally high levels of economic confidence.

f) In February of 2011 the ratio broke below the bottom of its long-term range and rapidly moved down to around 30. The huge price run-up in silver that led to this large/fast decline in the gold/silver ratio was fueled by the overt bullishness of a high-profile/well-heeled speculator (Eric Sprott) and by various rumours, including rumours of silver shortages and the unwinding of a price-suppression scheme led by JP Morgan. There were no silver shortages and there was no price-suppression scheme to be unwound, but as is often the case in the financial markets the facts didn’t get in the way of a good story.

g) The 2010-2011 parabolic rise in the silver price ended the same way that every similar episode in world history ended — with a price collapse.

h) Silver’s Q2-2011 price collapse set in motion a major, multi-year upward trend in the gold/silver ratio. In this case, the upward trend in the ratio was driven by the deflating of a commodity investment bubble and problems in the European banking industry. The ratio rose all the way to the low-80s and is still at an unusually-high level in the 70s.

gold_silver_010517

The gold/silver ratio’s performance over the past five decades suggests that the 45-60 range can now be considered normal, with moves well beyond the top of this range requiring a banking crisis and/or bursting bubble and moves well beyond the bottom of this range requiring rampant speculation focused on silver.

*In this post I’m lumping speculative, safe-haven and savings-related demand together under the term “investment demand”.

Print This Post Print This Post

The much-maligned paper gold market

The article “What sets the Gold Price — Is it the Paper Market or Physical Market?” contains some interesting information about the gold market and is worth reading, but it also contains some logical missteps. In this post I’ll zoom in on a couple of the logical missteps.

The following two paragraphs from near the middle of the above-linked article capture the article’s theme and will be my focus:

In essence, trading activity in the London gold market predominantly represents huge synthetic artificial gold supply, where paper gold trading is deriving the price of gold, not physical gold trading. Synthetic gold is just created out of thin air as a book-keeping entry and is executed as a cashflow transaction between the contracting parties. There is no purchase of physical gold in such a transaction, no marginal demand for gold. Synthetic paper gold therefore absorbs demand that would otherwise have flowed into the limited physical gold supply, and the gold price therefore fails to represent this demand because demand has been channelled away from physical gold transactions into synthetic gold.

Likewise, if an entity dumps gold futures contracts on the COMEX platform representing millions of ounces of gold, that entity does not need to have held any physical gold, but that transaction has an immediate effect on the international gold price. This has real world impact, because many physical gold transactions around the world take this international gold price as the basis of their transactions.

The most obvious error in the above excerpt concerns the effect of ‘dumping’ gold futures contracts on the COMEX. While this action could certainly have the immediate effect of pushing the gold price down, the short-sale of a futures contract must subsequently be closed via the purchase of a futures contract. This means that there can be no sustained reduction in the gold price due to the selling of futures contracts.

A related error is one of omission, since the gold price is often boosted by the speculative buying of futures contracts. Again, though, the effect will be temporary, since every purchase of a futures contract must be followed by a sale.

With regard to the massive non-futures paper gold market, the existence of such a market is a consequence of gold’s unique role in the commodity world. Whereas the usefulness of other commodities stems from the desire to consume them in some way, gold is widely considered to be at its most useful when it is sitting dormant in a vault. This means that to get the benefit of owning gold a person doesn’t necessarily need physical access to the gold. In many cases, a paper claim to gold sitting in a vault on the other side of the world will be considered as good as or better than having the physical gold in one’s possession. Furthermore, in many cases a piece of paper that tracks the price of gold will be considered as good as a paper claim to physical gold in a vault.

At the same time, there will be people who want ownership of physical gold — either gold in their own possession or a receipt that guarantees ownership of a specific chunk of metal stored in a vault. The gold demand of such people could not be satisfied by a piece of paper that tracked the gold price and was settled in dollars or some other currency. In other words, demand for physical gold could not be satisfied by the creation of so-called “synthetic artificial” gold.

The reality is that the existence of the massive non-futures-related “paper” gold market effectively results in a lot more gold supply AND a lot more gold demand than would otherwise be the case. To put it more succinctly, it results in a much bigger and more liquid market. This, in turn, makes it more feasible for large-scale speculators to get involved in the gold market and would not necessarily result in the gold price being lower than it would be if trading were limited to physical gold.

On a related matter, there is not a massive non-futures paper market in platinum and yet the platinum price is close to a 50-year low relative to the gold price. Also, the general level of commodity prices, as represented by the GSCI Spot Commodity Index (GNX), made an all-time low relative to gold last year. If the “paper” market is suppressing the gold price, why has gold become so expensive relative to most other commodities?

I view the whole paper-physical debate as a distraction from the true drivers of the gold price. The fact is that gold’s price movements can best be understood by reference to ‘real’ interest rates, currency exchange rates, and indicators of economic and financial-system confidence — what I refer to as gold’s true fundamentals. For example and as illustrated by the following chart, the bond/dollar ratio does a good job of explaining gold’s price trends most of the time.

gold_USBUSD_040417

In conclusion, the “paper” gold market is not a problem to be reckoned with. It is just part of the overall gold situation and, as noted above, a consequence of gold’s historical role. Moreover, it isn’t going anywhere, so it makes no sense to either complain about it or base a bullish view on its disappearance.

Print This Post Print This Post

Increasing speculation in “paper gold”

An increase in the amount of gold bullion held by GLD (the SPDR Gold Shares) and other bullion ETFs does not cause the gold price to rise. The cause-effect works the other way around and in any case the amount of gold that moves in/out of the ETFs is always trivial compared to the metal’s total trading volume. However, it is reasonable to view the change in GLD’s gold inventory as a sentiment indicator.

Ironically, an increase in the amount of physical gold held by GLD and the other gold ETFs is indicative of increasing speculative demand for “paper gold”, not physical gold. As I’ve explained in the past (for example, HERE), physical gold only ever gets added to GLD’s inventory when the price of a GLD share (a form of “paper gold”) outperforms the price of gold bullion. It happens as a result of an arbitrage trade that has the effect of bringing GLD’s market price back into line with its net asset value (NAV). Furthermore, the greater the demand for paper claims to gold (in the form of ETF shares) relative to physical gold, the greater the quantity of physical gold that gets added to GLD’s inventory to keep the GLD price in line with its NAV.

Speculators in GLD shares and other forms of “paper gold” (most notably gold futures) tend to become increasingly optimistic as the price rises and increasingly pessimistic as the price declines. That’s the explanation for the positive correlation between the gold price and GLD’s physical gold inventory illustrated by the following chart.

gold_GLDtonnes_150816

Now, speculation in “paper gold” is both an effect of the gold price and an important short-term driver of the gold price. It is therefore fair to say that although changes in GLD’s gold inventory don’t cause anything, they often reflect changes in speculative sentiment that at least on a short-term basis do have a significant influence on the gold price. At the same time it is also fair to say that the influence of speculative buying/selling in the futures market is vastly greater (probably at least an order of magnitude greater) than the influence of speculative buying/selling of GLD shares. Refer to “The scale of the gold market” for details on relative size an influence.

The speculative demand for “paper gold” has certainly ramped up over the past several months. This is partly reflected by the increase in the GLD inventory shown on the above chart, but it is primarily reflected by the rise to an all-time high in futures-related speculation. This is illustrated below.

goldCOT_150816
Chart source: http://www.goldchartsrus.com/

The extent to which short-term speculators are bullish on gold is a risk. An unusually-elevated level of speculative enthusiasm will never be the cause of a reversal in the price trend from up to down, but it will exacerbate the decline that happens after the price-trend reverses for some other reason.

Print This Post Print This Post

There will never be a “commercial signal failure” in the gold market

Some commentators have been anticipating a “commercial signal failure” in the gold market for more than 15 years. Moreover, whenever the gold price experiences a large rally the same commentators routinely cite the potential for a commercial signal failure (CSF) as a reason to maintain a full position, the argument being that the coming CSF is bound to result in massive additional price gains. The reality, however, is that whereas a CSF is an extremely unlikely event in any commodity market, in the gold market it is an impossibility.

A CSF theoretically becomes possible in a commodity market after the price has been trending upward for some time, and speculators, as a group, have built-up an unusually-large net-long position in the commodity futures. Naturally, if speculators have a large net-long position then “commercials” have an equivalently-large net-short position, since one is a mathematical offset of the other.

Commercials are generally hedging or spread-trading, so once they have established a position they will usually be indifferent with regard to future price direction. Whatever they lose on the futures they will make in the physical, and vice versa. However, in some commodity markets it is possible for the supply or demand in the physical market to undergo such a sudden and dramatic change that exploding margin requirements on the futures side of a commercial-trader’s hedge or spread-trade could force the commercial to exit (buy back) the short futures position, even though the short position in the futures is ‘covered’ by a long position in the physical. For example, take the case of a wheat farmer who has locked in the price of his yet-to-be-harvested crop by selling wheat futures. If extreme and unexpected weather suddenly causes a moon-shot in the wheat price then the farmer might — depending on how his price hedging has been structured — be faced with a huge margin call on his futures position and forced to exit his hedge, even if his own crop is unaffected by the extreme weather. Exiting the hedge would involve buying wheat futures into a sharply rising market, which would only exacerbate the price rise.

If it happens on a market-wide scale, the hypothetical case of the wheat farmer described above could be part of what’s called a “commercial signal failure”. The so-called signal failure involves commercial traders being forced, en masse, to cover their short futures positions at large losses despite the short futures positions being offset by long positions in the physical commodity. By definition, it can only happen when speculators have built up a large net-long position in the futures market (meaning, when commercial traders have built up a large net-short position in the futures, thus generating the bearish warning signal), a situation that will usually only arise after the price has been in a strong upward trend for several months. Due to the CSF, speculators on the long side make more money more quickly than they were expecting.

However, even in a market where a CSF is technically possible, a prudent speculator would never bet on it. The reasons are that 1) a CSF requires a sudden and totally UNPREDICTABLE change in either supply or demand, and 2) CSF’s almost never happen. In the rare cases when a CSF happens it tends to be the result of an unexpected supply disruption. In agricultural commodities, the most likely cause is an unforeseeable bout of extreme weather.

Major supply disruptions are possible in the markets for all agricultural and industrial commodities, but they are not possible in the gold market. This is primarily because almost all the gold ever mined still forms part of the supply side of the equation, which means that shifts in the current year’s mine production will always be trivial relative to total supply. In other words, in the gold market there is no chance that a CSF could be caused by a major supply disruption.

Although a major supply disruption is not possible in the gold market, there could at some point be a large and unanticipated demand disruption (note that the bulk of the world’s gold is demanded (held) for investment, store-of-value, speculative or monetary purposes). However, such a disruption would not cause a “commercial signal failure”; it would be the EFFECT of a total monetary-system failure.

A “commercial signal failure” is, by definition, an event that results in bullish futures speculators making large and rapid gains, but bullish speculators in gold futures could not profit from a total monetary-system failure. In fact, they would be big losers because the futures market would shut down in such an outcome.

The bottom line is that it is not a good idea to bet of a “commercial signal failure” in any market, because the probability of it happening is extremely low. It is, however, a particularly bad idea to make such a bet in the gold market because in the gold market the event has a probability of zero.

Print This Post Print This Post

Gold and the Keynesian Death Spiral

Almost anything can be a good investment or a bad investment — it all depends on the price. Relative to the prices of other commodities the gold price is high by historical standards and in dollar terms gold is nowhere near as cheap today as it was 15 years ago, but considering the economic backdrop it offers reasonable value in the $1200s. Furthermore, considering the policies that are being implemented and the general lack of understanding on display in the world of policy-making, there’s a good chance that gold will be much more expensive in two years’ time.

The policies to which I am referring are the money-pumping, the interest-rate suppression and the increases in government spending that happen whenever the economy and/or stock market show signs of weakness. These so-called remedies are actually undermining the economy, so whenever they are applied in response to economic weakness they ultimately result in more weakness. It’s not a fluke, for example, that the most sluggish post-recession economic recovery of the past 60 years went hand-in-hand with history’s most aggressive demand-boosting intervention by central banks and governments.

It’s a vicious cycle that can aptly be called the ‘Keynesian death spiral’. The Keynesian models being used by policy-makers throughout the world are based on the assumption that when interest rates are artificially lowered and new money is created and government spending is ramped up, the economy gets stronger. The models are completely wrong, because falsifying price signals leads to investing errors and therefore hurts, not helps, the overall economy, and because the government doesn’t have a spare pile of wealth that it can put to work to create real growth (everything the government spends must first be extracted from the private sector). However, the models are never questioned.

When a sustained period of economic growth fails to materialise following the application of the demand-boosting remedies, the conclusion is always that the remedies were not applied with sufficient vigor. More of the same is hence deemed necessary, because that’s what the models indicate. It’s akin to someone with liver damage caused by drinking too much alcohol being guided by a book that recommends addressing the problem by increasing alcohol consumption. A new dose of alcohol will initially make the patient feel better at the same time as it adds to the existing damage, just as a new dose of demand-boosting intervention will initially make the economy seem stronger at the same time as it gets in the way of genuine progress.

The upshot is that although gold is more expensive today than it was 15 years ago, the level at which gold offers good value is considerably higher today than it was back then because we are now much further along the Keynesian death spiral.

Print This Post Print This Post

News of gold and silver price manipulation is not news

It was reported last week that Deutsche Bank has settled lawsuits over allegations it manipulated gold and silver prices via the “London Fix“. This is not really news, in that experienced traders would already be aware that banks and other large-scale operators regularly attempt to shift prices one way or the other in most financial markets to benefit their own bottom-lines. I just wanted to point out that this “news” does not, in any way, shape or form, constitute evidence that there has been a successful long-term price suppression scheme in the gold and silver markets.

As far as I can tell, the banks that were involved in setting the twice-daily levels for the London gold and silver fixes had two ways of using or manipulating the ‘fix’ to generate profits. The first is that the participants in the fixing process were privy, for two very brief periods (10-15 minutes, on average) each day, to non-public supply-demand information, making it possible for them to obtain a very brief advantage in their own trading. For example, if the volume of gold being bid for was significantly greater than the volume being offered near the start of a particular day’s fixing process, a participant would know that the price was likely to rise over the ensuing few minutes and could enter a long position with the aim of exiting at around the time the ‘fix’ was announced.

The other way of using or manipulating the ‘fix’ to generate profits is more sinister, as it essentially involves the ‘fix’ participants stealing from their clients. I’m referring to the fact that although the ‘fix’ is primarily a market price, in that it is designed to reflect the bids and offers in the market at a point in time, the participating banks would have the ability to nudge the price in one direction or the other. Situations could arise where a participating bank could improve its bottom line at the expense of a client by influencing the ‘fix’ in a way that, for example, prevented an option held by the client from expiring in the money or allowing the bank to purchase gold from the client at a marginally lower price.

I don’t know that the participants in the London ‘fixing’ process sometimes used the process to increase their own profits at their clients’ expense, but I wouldn’t be the least bit surprised if they did. There was certainly a huge conflict of interest inherent in the way the ‘fix’ was conducted.

Anyhow, it’s important to understand that price distortions resulting from the ‘fix’ would have existed only briefly (for less the 20 minutes in all likelihood) and could not have affected the price trends of interest to anyone other than intra-day traders. In particular, there is simply no way that a multi-month price trend could have been shifted from bullish to bearish or bearish to bullish by manipulating the London gold or silver fix.

Print This Post Print This Post

The true meaning of gold’s COT data

This post is a slightly-modified excerpt from a recent TSI commentary.

The COT (Commitments of Traders) data for gold is portrayed by some commentators as an us-versus-them battle, with “them” (the bad guys) being the Commercials. Whether this is done out of ignorance or because it makes a good story that attracts readers/subscribers, it paints an inaccurate picture.

As I’ve explained in numerous TSI commentaries over the years, the Commercial position is effectively just the mathematical offset of the Speculative position. Speculators, as a group, cannot go net-long by X contracts unless Commercials, as a group, go net-short by X contracts. Furthermore, we can be sure that Speculators are the drivers of the process because most of the time the Speculative net-long position moves in the same direction as the price.

With Speculators becoming increasingly long as the price rises, it will always be the case that the Speculative net-long position will be near a short-term maximum when the price is near a short-term high. This means that the Commercial net-short position must always be near a short-term maximum when the price is near a short-term high, creating the false impression that the Commercials are always right at price tops.

The reality is that the Commercials are neither right nor wrong, since they generally don’t bet on price direction. In some cases they are selling-short the futures to hedge long positions in the physical, but in the gold market the dominant Commercials are the bullion banks that trade spreads between the physical and futures. If trading and other costs are low enough and volumes are high enough, the bullion banks can guarantee themselves profits — regardless of subsequent price direction — by buying/selling gold for future delivery and simultaneously selling/buying the physical metal.

Consider, for example, the situation where Speculators increase their collective demand for gold futures. If this additional Speculative demand causes the futures price to rise relative to the spot price it can create an opportunity for a bullion-bank Commercial to simultaneously sell the futures and buy the physical, thus locking-in a profit equal to the spread (between the futures price and the spot price) less the costs of storage, insurance and financing. At a time when the official interest rate is near zero, even a tiny futures-physical spread in the gold market can create the opportunity for a profitable trade.

I’m going back over this old ground to make sure that TSI readers aren’t taken-in by the popular, but wrongheaded, conspiracy-centric us-versus-them characterisation of the COT information.

Print This Post Print This Post

The “Streetlight Effect” in the gold market

In an old joke, a policeman sees a drunk searching for something under a streetlight and asks what he has lost. The drunk says that he lost his keys, and they both start looking under the streetlight together. After a few minutes the policeman asks the drunk if he is sure he lost them here, and the drunk replies, “no, I lost them in the alley”. The policeman then says “so why are you looking here?”, and the drunk replies, “because this is where the light is”. This joke led to the name “Streetlight Effect” being given to a psychological tendency for people to look for clues where it is easiest. Many gold-market analysts have obviously succumbed to this psychological tendency.

It is obvious that many gold-market analysts have succumbed to the “Streetlight Effect” because they fixate on a tiny fraction of the overall gold supply and they do so because this tiny fraction of the overall supply is where the well-defined numbers are. The rest of the supply, which probably accounts for at least 90% of the total, is ignored because its location can’t be pinpointed and its size can’t be accurately measured. In effect, due to a lack of definitive data they make the assumption that the bulk of the world’s gold supply doesn’t exist. No wonder their supply-demand analyses don’t make sense.

To be more specific, there are many gold-market analysts who focus on the amount of gold produced by the mining industry, the amount of gold in COMEX warehouses, the publicly-reported warehouse stocks in London and the bullion inventories of gold ETFs, as if the sum of these quantities was a reasonable estimate of the world’s total amount of gold in saleable form. This is a huge mistake. Furthermore, they assume that once gold leaves a warehouse for which there are publicly-reported numbers the gold effectively ceases to exist, as if it has evaporated into the air. However, it is far more reasonable to assume that almost every ounce of gold that leaves a publicly-reported inventory remains part of the total supply.

In any case and as I explained last week, even if the “Streetlight Effect” didn’t apply and the location of every ounce of aboveground gold was known, the information wouldn’t tell us anything about the price and therefore wouldn’t be useful from an investing/speculating perspective.

Print This Post Print This Post

Changes in gold location say nothing about the gold price

It’s amazing how much time and effort is spent by some analysts in attempting to track the movements of gold between locations. It’s amazing because such analysis provides no useful information about price, that is, such analysis has no practical value for speculators and investors.

Regardless of whether the gold price is in a rising trend or a falling trend, some parts of the world will be net buyers and other parts of the world will be net sellers. Furthermore, the amount of gold being shifted between sellers and buyers could rise or fall during a rising price trend or a falling price trend. To put it more succinctly: transaction volume does not indicate price direction.

Consequently, even if it were possible to track all of the movements in gold that were happening throughout the world every day, the resulting data would not provide reliable clues about the future change in the gold price. In fact, the data wouldn’t even do a good job of explaining past changes in the gold price. And in any case, accurately tracking the movements of gold is not remotely close to being possible.

A common mistake is to fixate on the gold being stored in LBMA and COMEX inventories, as if these publicly-reported warehouse stocks represented the total amount of privately-held gold in saleable form. A related mistake is to assume that when gold is shifted out of a publicly-reported inventory it has effectively been taken off the market and is no longer part of the available supply.

In reality, the bulk of the world’s privately-held gold in readily-saleable form will NEVER be part of a publicly-reported inventory. That’s due to the perceived nature of gold. Many people own gold for store-of-value or financial-safety purposes and do not want to report their ownership, especially to governments. On a related point, just because gold has been removed from an LBMA or a COMEX warehouse and can no longer be tracked by the likes of Gold Fields Mineral Services (GFMS) does not mean that the gold is no longer part of the supply-demand equation. It is still available; it’s just that you, the analyst, have no way of knowing where it is.

Gold-market analysts should accept reality and stop pretending that the supply of gold is limited to the amount that they can pinpoint.

Print This Post Print This Post

A chart that refutes the gold price suppression story

The assertion that the gold price has been successfully manipulated downward over a great many years via the relentless selling of “paper gold” contains more than a few logical and factual holes. In this brief post I’m going to highlight one of these holes.

Before I get to the main point, it’s worth pointing out that in order to sell “paper gold” there must be demand for “paper gold”, since demand for physical gold cannot be satisfied with paper claims. It is also worth pointing out that downward pressure on the price of “paper” gold that was not supported by the “physical” market would inevitably result in the price of “paper” gold making a sustained and substantial move below the price of the physical commodity, which hasn’t happened. Over the past several years the prices of gold futures contracts have generally been very close to the spot price and there have been regular small dips in futures prices to below the spot price, but this situation is a natural and predictable effect of the Fed’s unnatural zero-interest-rate policy. Taking the US$ interest-rate backdrop into account, the price of “paper” gold has generally not been lower relative to the price of physical gold than a knowledgeable observer would expect.

The main point of this post is that while gold is different from other commodities, under the current monetary system the price of gold should never become completely divorced from the prices of other commodities. In particular, the price of gold should always remain within certain bounds relative to the price of platinum.

Now, the platinum market effectively ‘lives from hand to mouth’, in that the bulk of the current year’s consumption will be satisfied by the current year’s production. It should therefore be obvious to anyone with a modicum of objectivity that it isn’t possible to manipulate the platinum price downward, beyond brief fluctuations, by selling paper claims to the commodity. As a result, the multi-decade high in the gold/platinum ratio illustrated by the following chart is evidence that if there has been a concerted attempt to suppress the gold price, it has been ineffective to put it mildly.

gold_plat_010216

I’ve come to understand that adopting the view that the gold market has been subject to a successful and long-term price suppression scheme is like adopting a child — it’s a lifetime commitment through thick and thin. I therefore don’t expect to change anyone’s opinion on this topic, but I’m hoping that some readers still have open minds.

Print This Post Print This Post

The ridiculous and relentless fuss over the COMEX gold inventory

I’ve often been impressed by the ability of gold-focused bloggers, newsletter writers and journalists to turn a blind eye to the gold market’s genuine fundamentals and to fixate on factors that either have no bearing on the gold price or amount to unadulterated hogwash. Depending on how they are presented, the stories that are regularly told about the COMEX gold inventory and its relationship to the gold price can fall into either the irrelevant category or the hogwash category.

I’ve mentioned numerous times in the past, including in an 18th August blog post, that the amount of gold in COMEX warehouses and the inventories of gold ETFs follow the major price trend, meaning that changes in these high-profile inventories are effects, not causes, of major changes in the gold price. That’s the long-term relationship. On a short-term basis there is no consistent relationship between inventory levels and the gold price.

There is therefore nothing strange about the fact that the post-2011 bear market in gold has been accompanied by an overall decline in COMEX and gold ETF inventories, just as there was nothing strange about the overall rise in COMEX and gold ETF inventories during the preceding bull market.

I’ve also briefly pointed out in the past that the large rise in the ratio of COMEX “registered” gold to COMEX gold open interest in no way indicates a shortage of physical gold or that a COMEX delivery problem is brewing.

Various sites have been presenting the aforementioned ratio for years as if it were a dramatic, price-impacting development. A recent example is the ZeroHedge article posted HERE, which contains the following chart. This chart certainly creates the impression that something is horribly wrong. A more distant example is the JSMineset article posted HERE, which is from July-2013 and forecasts a COMEX crisis within 90 days due to the critical shortage of deliverable gold.

Fortunately, early this week a logical and well-informed article on the topic was posted HERE. You should read the full article as long as you are willing to let facts get in the way of a good story, but two of the key points are:

1) The amount of “registered” gold is NOT the total amount of gold available for delivery.

2) Although it’s unlikely to give you any meaningful information, if you really want to spend time comparing open interest and physical gold inventory then it’s only the open interest in the current delivery month that matters.

It’s hard enough to figure-out the gold market when considering only the true fundamentals. There’s no need to further muddy the waters by introducing spurious information, unless the goal is to draw readers with exciting stories rather than to be accurate.

Print This Post Print This Post

Gold’s “commercial” traders are different because gold is different

In a typical commodity market the traders known as “commercials” are usually hedging their exposure to the physical commodity when they buy or sell futures contracts. For example, in the oil market the most important “commercials” include oil producers, who are naturally ‘long’ the physical commodity and often sell futures contracts to hedge this exposure, and manufacturers of oil-based products, who are effectively ‘short’ the physical commodity (by virtue of the fact that oil is one of their biggest costs) and often buy futures contracts to hedge this exposure. However, the gold market is different.

Some of the commercial traders operating in the gold market are traditional hedgers. Mining companies and jewellery manufacturers, for example. But given that the existing aboveground stock of gold dwarfs the annual supply of new gold and that the amount of gold that changes hands for store-of-value, investment and speculative purposes dwarfs the amount of gold bought/sold for more traditional commercial uses such as fashion jewellery and electronics, a reasonable and knowledgeable person would expect that traditional commercial traders would play a relatively small role in the gold market. A reasonable and knowledgeable person would be right.

In the gold market the dominant commercials are not traditional hedgers. They are also not speculators, in that they rarely take positions that rely on the gold price moving in a particular direction. They are spread traders, meaning that they make their profits by trading the differences in price between the physical and futures markets.

For example, if speculative buying of gold futures causes the futures price to rise relative to the spot price by a sufficient amount it will create an essentially risk-free arbitrage opportunity for a commercial to sell the futures and buy the physical, and if speculative selling of gold futures causes the futures price to fall relative to the spot price by a sufficient amount it will create an essentially risk-free arbitrage opportunity for a commercial to buy the futures and sell the physical. For another example, if gold buying by hoarders of physical gold causes the cash (physical) price to rise relative to the futures price by a sufficient amount it will create an essentially risk-free arbitrage opportunity for a commercial to sell the physical and buy the futures, and if the ‘dishoarding’ of physical gold causes the cash (physical) price to fall relative to the futures price by a sufficient amount it will create an essentially risk-free arbitrage opportunity for a commercial to buy the physical and sell the futures. In other words, commercial trading in the gold market is mostly about arbitrage.

The difference between commercial trading in the gold market and commercial trading in all other commodity markets is tied to gold’s long history as money. Strangely, many gold ‘experts’ assert that gold is different due to its dominant monetary and store-of-value roles, but then insist on applying a traditional commodity-style method of supply-demand analysis. Unsurprisingly, the result is a pile of hogwash.

Print This Post Print This Post

Gold is not money: the final word

In a recent article Mike Shedlock (Mish) weighs in on the question of whether or not gold is money. Near the end of the article he concludes: “The only possible debate about whether or not gold is money pertains to the phrase “demanded mainly as a medium of exchange”.” That’s totally correct, which is why it is not correct to say that gold is money. However, earlier in the same article Mish seems to argue that gold has again become money thanks to the advent of BitGold. As discussed below, this makes no sense.

There are two major problems with the argument that the advent of BitGold means that gold is now (once again) money. The first and more important is that the BitGold system comprises only a miniscule fraction of the total gold supply, so in no way does it result in gold being “demanded mainly as a medium of exchange”.

The second problem is that the BitGold debit card does not involve using gold as money. When someone uses such a card to buy something, the merchant doesn’t receive gold in exchange for goods/services. What happens is that some of the gold in the cardholder’s account is sold to obtain “money”, which is then transferred to the merchant. In this respect, paying for something using a BitGold debit card is similar to paying for something by writing a cheque on a Money-Market Fund (MMF). When you pay using a MMF cheque (check, if you are American), the receiver of the cheque doesn’t end up with MMF units. What happens is that the MMF sells some of its assets to obtain the “money” needed to complete the transaction. That’s why MMFs should not be counted in the money supply. They are investments in securities, not money.

Moving on, it’s important to understand that money isn’t just ‘a’ medium of exchange. At any given time in any economy, many things will be occasionally used as media of exchange, that is, as currencies. Take Frequent Flyer Miles as an example. Frequent Flyer Miles are sometimes used as a medium of exchange. In fact, in most developed economies they are used more commonly than gold as a medium of exchange. However, nobody is seriously claiming that Frequent Flyer Miles are money. Cigarettes are another example. Cigarettes are used as mediums of exchange in some prisons, but cigarettes obviously aren’t economy-wide “money” and nobody (as far as we know) is seriously claiming otherwise. Clearly, then, sometimes being used as ‘a’ medium of exchange is not the same as being money.

Money is not simply A medium of exchange (a currency), it is THE medium of exchange used in the vast majority of economic transactions (a very commonly-used currency throughout the economy).

The final word goes to Ludwig von Mises, the greatest economist of the 20th Century. It was Mises who, from beyond the grave via his writings, convinced me many years ago that gold is no longer money*. Here is Mises from his book “The Theory of Money and Credit“:

The balancing of production and consumption takes place in the market, where the different producers meet to exchange goods and services by bargaining together. The function of money is to facilitate the business of the market by acting as a common medium of exchange.

And for those people who harp on about “store of value” as if it were the dominant characteristic of money:

The simple statement, that money is a commodity whose economic function is to facilitate the interchange of goods and services, does not satisfy those writers who are interested rather in the accumulation of material than in the increase of knowledge. Many investigators imagine that insufficient attention is devoted to the remarkable part played by money in economic life if it is merely credited with the function of being a medium of exchange; they do not think that due regard has been paid to the significance of money until they have enumerated half a dozen further ‘functions’ — as if, in an economic order founded on the exchange of goods, there could be a more important function than that of the common medium of exchange.

And here is Mises from his book “Human Action“:

The theory of money was and is always the theory of indirect exchange and of the medium of exchange.


[*Like many of the people who responded negatively to my "Gold Is Not Money" articles, once upon a time I also laboured under the misconception that gold was money.]
Print This Post Print This Post

Another look at Goldman’s bearish gold view

Early last year I gave banking behemoth Goldman Sachs (GS) credit for looking in the right direction for clues regarding gold’s likely performance, which is something that most gold bulls were not doing. In November I again gave them credit, because, even though I doubted that the US$ gold price would get close to GS’s $1050/oz price target for 2014, their overall analysis had been more right than wrong. It was clear that up to that point the US economy had performed better than I had expected and roughly in line with the GS forecast, which was the main reason that gold had remained under pressure; albeit, not as much pressure as GS had anticipated.

But this year it was a different story. Here’s what I wrote in a TSI commentary in January-2015:

This year, GS’s gold market analysis begins on the right track by stating that stronger US growth should support higher real US interest rates, which would be bearish for gold. Although we expect that the US economy will ‘tread water’ at best and that real US interest rates will be flat-to-lower over the course of this year, GS’s logic is correct. What we mean is that IF the US economy strengthens and IF real US interest rates trend upward in response, there will be irresistible downward pressure on the US$ gold price.

However, the analysis then goes off the rails. After mentioning something that matters (the real interest rate), the authors of the GS gold-market analysis then try to support their bearish case by listing factors that are either irrelevant or wrong. It actually seems as if they’ve taken the worst arguments routinely put forward by gold bulls and tried to use the same hopelessly flawed logic to support a bearish forecast.

For example, they argue that the demand for gold will fall because “inflation” levels are declining along with oil prices. They are therefore unaware, it seems, that “price inflation” has never been an important driver of the gold market and that the latest two multi-year gold rallies began with both “inflation” and inflation expectations low and in declining trends. They also appear to be unaware that the large decline in the oil price is very bullish for the gold-mining industry.

Their analysis then gets even worse, as they imply that the price weakness of the preceding three years is a reason to expect future weakness, whereas the opposite is closer to the truth. They go on to cite outflows from exchange-traded funds (ETFs) and reduced investment in gold coins as bearish influences, apparently unaware that the volume of gold coins traded in a year is always too small to have a noticeable effect on the price and that the change in ETF inventory is a follower, not a driver, of the gold price.

Finally, just when it seems as if their analysis can’t possibly go further off track, it does by asserting that lower jewellery demand and a greater amount of producer hedging will add to the downward pressure on the gold price. The facts are that jewellery demand has always been irrelevant to gold’s price trend and that gold producers are part of the ‘dumb money’ (meaning: they tend to add hedges at low prices and remove hedges at high prices, that is, they tend to do the opposite of what they should be doing based on gold’s intermediate-term risk/reward).

I concluded by stating that in 2014 the GS analysts were close to being right for roughly the right reasons, but that in 2015 they could not possibly be right for the right reasons. They would either be right for the wrong reasons, or they would be wrong.

At this stage it looks like they are going to be wrong about 2015, but not dramatically so. My guess is that gold will end this year in the $1100-$1200 range, thus not meeting the expectations of GS and other high-profile bears and at the same time not meeting the expectations of the bulls. However, GS is on record as predicting a US$1000/oz or lower gold price for the end of next year. I think that this forecast will miss by a wide margin, but I’m not going to make a specific price forecast for end-2016. Anyone who thinks they can come up with a high-probability forecast of where gold will be trading 15 months from now is kidding themselves.

Print This Post Print This Post

The right way to think about gold supply

Here’s the wrong way to think about gold supply: “Although gold’s aboveground inventory is huge compared to current production, only a tiny fraction of this gold will usually be available for sale near the current price. Therefore, changes in mine supply can be important influences on the gold price.” I’ll now explain the right way to think about gold supply.

Whenever I point out that the supply side of the gold market consists of the entire aboveground gold inventory, which is probably somewhere between 150K tonnes and 200K tonnes, and that the gold-mining industry does no more than add about 1.5%/year to this inventory, an objection I often get is that only a tiny fraction of the aboveground inventory is available for sale at any time. This is of course true, and nobody who has a correct understanding of gold supply has ever claimed otherwise.

If all, or even most, of the aboveground supply were for sale at the current price then the price would not be able to rise. The price can rise and fall by substantial amounts, however, because there is always a huge range of prices at which the owners of the aboveground supply are prepared to sell. Moreover, this range is constantly changing based on changing personal circumstances and assessments of the market. In addition, some holders of existing aboveground gold will be planning to hold forever. These plans, which are themselves subject to change in response to changing circumstances, also factor into the formation of the gold price, in that a decision to withhold X ounces of supply can have a similar effect to a decision to buy X ounces.

As I write, gold is trading in the $1120s. It is therefore certain that a tiny fraction of the aboveground supply is currently changing hands in the $1120s and that there are plans in place to sell other tiny fractions in the $1130s, the $1140s, the $1150s, and all the way up to some extremely high number. Some people will also have plans to sell gold if the gold price falls below a particular level and there will be millions of people who have no specific selling intentions who will decide to sell in the future for some currently unforeseeable reason. At the same time there will be countless plans in place to buy at certain levels and millions of people with no present intention to buy who will, for reasons that aren’t currently foreseeable, decide to buy in the future.

It is the combination of these myriad plans that determines the price. Furthermore and as mentioned above, over the days ahead many of these plans will change. For example, some gold-buying/selling intentions will change based on what happens to the stock market or the bond market.

How does the gold-mining industry fit into the situation?

The gold-mining industry is not materially different from any other seller except that its plans are not price sensitive. Specifically, every year it will sell an amount that’s equivalent to about 1.5% of the total aboveground supply regardless of price. At this time four years ago it was selling gold in the $1800s and it is now selling roughly the same amount of gold in the $1100s. It is the ultimate price-taker. To put it another way: whatever price arises from the changing plans of gold owners and potential owners, that’s the price at which gold producers will sell.

On a related matter, due to the huge existing aboveground supply of gold there should never be a genuine shortage of physical gold. Obtaining more gold should always be solely a question price. A consequence is that the gold market should never go into “backwardation”, that is, the spot gold price should always be lower than the price for future delivery. Just to be clear: in an abundantly-supplied commodity market the futures price should be higher than the spot price by enough to eliminate the risk-free profit that could otherwise be had by selling the physical and buying the futures. That’s why it would be very significant if the gold market were to make a sustained and sizeable move into backwardation. Such a development would indicate that holders of the aboveground supply were withdrawing their gold from the market en masse and/or that the gold futures market was breaking down due a collapse in trust. Even the small and brief backwardations of the past two years have some significance*, although recent gold backwardation episodes have more to do with near-zero short-term US$ interest rates than gold supply/demand. The point is that gold backwardation is only important because the existing aboveground supply in saleable form dwarfs the rate of annual production.

In summary, the price of gold is where it is because of the range of prices at which existing holders intend to become sellers and the concurrent range of prices at which potential future holders intend to become buyers. These ranges are constantly in flux due to changing perceptions and circumstances.

*Keith Weiner has written extensively about the significance of gold backwardation at https://monetary-metals.com/.

Print This Post Print This Post