Full width

Changes in gold location say nothing about the gold price

February 16, 2016

It’s amazing how much time and effort is spent by some analysts in attempting to track the movements of gold between locations. It’s amazing because such analysis provides no useful information about price, that is, such analysis has no practical value for speculators and investors.

Regardless of whether the gold price is in a rising trend or a falling trend, some parts of the world will be net buyers and other parts of the world will be net sellers. Furthermore, the amount of gold being shifted between sellers and buyers could rise or fall during a rising price trend or a falling price trend. To put it more succinctly: transaction volume does not indicate price direction.

Consequently, even if it were possible to track all of the movements in gold that were happening throughout the world every day, the resulting data would not provide reliable clues about the future change in the gold price. In fact, the data wouldn’t even do a good job of explaining past changes in the gold price. And in any case, accurately tracking the movements of gold is not remotely close to being possible.

A common mistake is to fixate on the gold being stored in LBMA and COMEX inventories, as if these publicly-reported warehouse stocks represented the total amount of privately-held gold in saleable form. A related mistake is to assume that when gold is shifted out of a publicly-reported inventory it has effectively been taken off the market and is no longer part of the available supply.

In reality, the bulk of the world’s privately-held gold in readily-saleable form will NEVER be part of a publicly-reported inventory. That’s due to the perceived nature of gold. Many people own gold for store-of-value or financial-safety purposes and do not want to report their ownership, especially to governments. On a related point, just because gold has been removed from an LBMA or a COMEX warehouse and can no longer be tracked by the likes of Gold Fields Mineral Services (GFMS) does not mean that the gold is no longer part of the supply-demand equation. It is still available; it’s just that you, the analyst, have no way of knowing where it is.

Gold-market analysts should accept reality and stop pretending that the supply of gold is limited to the amount that they can pinpoint.

Print This Post Print This Post
There is nothing inherently wrong with market manipulation

February 15, 2016

The financial markets have always been manipulated and always will be manipulated. They are manipulated when they are free and they are manipulated when they are heavily regulated by government. If you choose to be involved in the markets, you should accept this reality. If you cannot accept this reality then you should get out of the markets and never return. If you try to change this reality by advocating greater government regulation of the markets then you are part of the problem.

Manipulating a market involves attempting to give yourself an advantage by encouraging the price to move higher or lower. For example, if you wanted to buy you would possibly try to create the impression that there is greater supply than is actually the case, prompting other traders to sell and causing the price to decline. If you wanted to sell you would possibly try to create the impression that there is greater demand than is actually the case, prompting other traders to bid-up the price. Whether currently legal or not, there is nothing ethically wrong with private entities using such tactics*.

A hundred years ago the manipulation of market prices was generally not considered to be unfair. In fact, highly-respected traders such as Jesse Livermore would sometimes be hired for the purpose of manipulating a market in such a way as to allow a large position to be either bought or sold at a better price than could otherwise be achieved. The best traders could do this by selling and buying in such a way as to create a false impression of the underlying market strength in the minds of other traders.

These days, governments are heavily involved in the financial markets in an effort to create a “level playing field”. As a result, the average investor has never before been at such a disadvantage. Rather than the likes of Jesse Livermore manipulating prices of individual securities from time to time, we now have central bankers treating the major financial markets as if they were puppets that could be moved in any desired way by pulling the right strings.

Never before have prices in the financial markets been so distorted and deceptive, but people now feel more secure because it is clear that the government and its agents are hard at work ensuring that nobody can take advantage of anbody else. Moreover, whenever anything goes wrong in the markets the popular outcry is: “The government oughta do something!” So, everytime something goes wrong and a lot of people lose money it creates the justification for even greater regulation with the stated goal of making the markets safer.

A lot of people are horrendously misguided. They believe that the right government regulations are needed to create a free market, but this only demonstrates that they have absolutely no idea what a free market is. A genuinely-free market is one that is devoid of government intervention. As soon as the government starts regulating a market, the market is no longer free. The greater the regulation, the less free the market.

Is there a reason to be optimistic that a shift towards freer markets lies in the not-too-distant future?

Unfortunately, no, because very few people are prepared to give up even an ounce of perceived security to gain a pound of additional freedom.

*Note: Not all actions that fall under the “manipulation” umbrella are ethical. For example, whether legal or not, it would generally not be ethical for a bank or broker to front-run the orders of its customers if doing so resulted in the customers getting a worse price. Such actions are a breach of trust and/or fiduciary duty. Also, regardless of whether or not its purpose is price manipulation, government involvement in the financial markets is generally unethical because governments operate with stolen money.

Print This Post Print This Post
Gold versus silver during bull markets

February 10, 2016

This post is a modified excerpt from a recent TSI report.

A popular view is that silver outperforms gold during bull markets for these metals, but that’s only true if the entire bull market is considered. That is, it’s true that silver has in the past achieved a greater percentage gain than gold from bull-market start to bull-market end. However, since the birth of the current monetary system the early stages of gold-silver bull markets have always been characterised by relative WEAKNESS in silver.

To check that this is, indeed, the case, refer to the following long-term chart of the silver/gold ratio. The boxes labeled A, B and C on this chart indicate the first two years of the cyclical precious-metals bull markets of 1971-1974, 1976-1980 and 2001-2011, respectively. Clearly, silver underperformed gold during the first two years of each of the last three cyclical precious-metals bull markets that occurred within secular bull markets. Therefore, assuming that a gold bull market has either just begun or will soon begin, on what basis should we expect to see persistent and substantial strength in silver relative to gold over the coming 1-2 years?

The one plausible answer to the above question is that the scope for additional weakness in silver relative to gold has been greatly diminished by the extent to which silver has already fallen relative to gold. In particular, in gold terms silver is now almost as cheap as it was in early-2003 (2 years into the most recent previous bull market), which means that it is close to its lowest price of the past 20 years. Silver is also now vastly cheaper relative to gold than it was when cyclical bull markets were getting underway in 1971 and 1976.

In summary, history tells us to expect continuing weakness in silver relative to gold during the first two years of the next precious-metals bull market (which has possibly just begun), whereas the unusually-depressed current level of the silver/gold ratio suggests that the historical precedents might not apply this time around.

I don’t have a strong preference either way.

Print This Post Print This Post
The US government debt held by the Fed is interest free

February 8, 2016

There are things that monetary enthusiasts* such as me take for granted that are not widely understood. In an email discussion with a friend and fellow monetary enthusiast it occurred to me that the treatment of interest paid on the debt held by the Fed might be one of those things. That’s the reason for this short post.

The Fed currently has about 4.2 trillion dollars of debt securities on its balance sheet, about 2.5 trillion dollars of which are US Treasury securities. The interest that the Fed earns on all of its debt securities — less a relatively small amount to cover the Fed’s own operating expenses — gets paid into the General Account of the US Treasury. In other words, the interest that the US government pays on the Treasury bonds, notes and bills held by the Fed gets returned to the government. This effectively means that any US government debt held by the Fed is interest free.

An implication is that if government debt is held by the Fed, the interest rate on the debt is irrelevant. An interest rate of 20% is essentially no different to an interest rate of 1%, since whatever is paid by the government returns to the government.

Another implication is that when considering what-if interest-rate scenarios and the ability of the US government to meet its financial obligations under the different scenarios, the assumption should be made that the portion of the debt held by the Fed has an effective interest rate of zero. For example, let’s say that at some point in the distant future the average interest rate on the US government’s debt has risen to 10% and the Fed owns 80% of the debt. In this hypothetical — but not completely farfetched — situation, the effective average interest rate on the US government’s debt would only be 2%.

The bottom line is that it’s not so much the Fed’s interest-rate suppression that benefits the US government, it’s the fact that the interest-rate suppression is conducted via the large-scale accumulation of the government’s debt.

* People who spend significant time every week tabulating/charting monetary statistics and poring over reports published by the US Federal Reserve and other central banks.

Print This Post Print This Post
Explaining gold’s relative expensiveness

February 5, 2016

In the blog post “Some gold bulls need a dose of realism“, I noted that relative to the Goldman Sachs Spot Commodity Index (GNX) the gold price was at an all-time high and about 30% above its 2011 peak. I then wrote: “Rather than imagining a grand price suppression scheme involving unlimited quantities of “paper gold” to explain why gold isn’t more expensive, how about trying to explain why gold is now more expensive relative to other commodities than it has ever been.

A rational explanation of gold’s relative expensiveness begins with the premise that major trends in the gold/commodity ratio are invariably associated — in an inverse manner — with major trends in economic confidence. Since credit spreads are one of the best indicators of economic confidence, with generally-widening credit spreads signifying declining confidence and generally-narrowing credit spreads signifying rising confidence, it would be logical if there were a positive correlation between the gold/commodity ratio and credit spreads. As evidenced by the following chart, that’s exactly what there is.

goldGNX_IEFHYG_030216

The current widening trend for credit spreads dates back to mid-2014, which is when the oil price began to trend downward and obvious cracks began to appear in the global growth theme. More recently, cracks began to appear in the US growth theme and the pace of credit-spread widening accelerated, leading to an accelerated rise in the gold/commodity ratio.

Could gold become even more expensive relative to commodities in general? The answer is yes, but only if economic confidence continues to decline.

I doubt that the decline in economic confidence has run its course, so I expect the gold/commodity ratio to move further into new-high territory before something more important than a short-term top is put in place. However, there’s a good chance that the gold/commodity ratio will make a multi-year peak this year, due mainly to increasing strength (catch-up moves) in other commodities.

Print This Post Print This Post

A chart that refutes the gold price suppression story

February 2, 2016

The assertion that the gold price has been successfully manipulated downward over a great many years via the relentless selling of “paper gold” contains more than a few logical and factual holes. In this brief post I’m going to highlight one of these holes.

Before I get to the main point, it’s worth pointing out that in order to sell “paper gold” there must be demand for “paper gold”, since demand for physical gold cannot be satisfied with paper claims. It is also worth pointing out that downward pressure on the price of “paper” gold that was not supported by the “physical” market would inevitably result in the price of “paper” gold making a sustained and substantial move below the price of the physical commodity, which hasn’t happened. Over the past several years the prices of gold futures contracts have generally been very close to the spot price and there have been regular small dips in futures prices to below the spot price, but this situation is a natural and predictable effect of the Fed’s unnatural zero-interest-rate policy. Taking the US$ interest-rate backdrop into account, the price of “paper” gold has generally not been lower relative to the price of physical gold than a knowledgeable observer would expect.

The main point of this post is that while gold is different from other commodities, under the current monetary system the price of gold should never become completely divorced from the prices of other commodities. In particular, the price of gold should always remain within certain bounds relative to the price of platinum.

Now, the platinum market effectively ‘lives from hand to mouth’, in that the bulk of the current year’s consumption will be satisfied by the current year’s production. It should therefore be obvious to anyone with a modicum of objectivity that it isn’t possible to manipulate the platinum price downward, beyond brief fluctuations, by selling paper claims to the commodity. As a result, the multi-decade high in the gold/platinum ratio illustrated by the following chart is evidence that if there has been a concerted attempt to suppress the gold price, it has been ineffective to put it mildly.

gold_plat_010216

I’ve come to understand that adopting the view that the gold market has been subject to a successful and long-term price suppression scheme is like adopting a child — it’s a lifetime commitment through thick and thin. I therefore don’t expect to change anyone’s opinion on this topic, but I’m hoping that some readers still have open minds.

Print This Post Print This Post

The COMEX inventory nonsense continues

February 1, 2016

A ridiculous fuss continues to be made in some quarters about the ratio of “registered” COMEX gold to total futures open interest. For example, a 26th January ZeroHedge article includes the following chart and implies that the high (542:1) ratio of open interest to “registered” gold could soon result in a COMEX default. To put it politely, this is unadulterated hogwash.

As explained HERE, the ratio cited in the above-linked article is meaningless, and, in any case, there are now about 15 ounces of physical gold in COMEX warehouses for every ounce that will potentially have to be delivered during the current delivery month. And as explained HERE, converting “eligible” gold to “registered” gold is a quick and easy process.

Don’t be taken in by what are either deliberately misleading presentations of COMEX data or blatant displays of ignorance regarding how the commodity exchange works.

Print This Post Print This Post

What do changes in GLD’s bullion inventory tell us about the future gold price?

January 30, 2016

Physical gold ‘flowing’ into GLD and the other gold ETFs does not cause the gold price to rise and physical gold flowing out of gold ETFs does not cause the gold price to fall. The cause and effect actually works the other way around, with the price change being the cause and the flow of gold into or out of the ETFs being the effect. I’ve covered the reasons before (for example, HERE and HERE), but cause and effect are regularly still being mixed up in gold-related articles so I’m revisiting the topic.

The Net Asset Value (NAV) of a gold ETF such as GLD naturally moves up and down by the same percentage amount as the gold price, so a change in the gold price will not necessarily require any change in the size of GLD’s bullion inventory. It’s only when GLD’s market price deviates from its own NAV that a change in bullion inventory occurs. For example, assume that the gold price gains 10%. In this case, GLD’s NAV will gain 10% and there will be no increase or decrease in GLD’s inventory as long as GLD’s market price also rises by 10%. However, if GLD’s market price rises by 11% then gold will be added to the ETF’s inventory to bring its market price and NAV back into line, and if GLD’s market price rises by only 9% then gold will be removed from the ETF’s inventory to bring its market price and NAV back into line.

Note that the manager of the ETF doesn’t have to initiate anything in the above-described process. The ETF’s Authorised Participants (APs) initiate the process in order to generate arbitrage profits. More specifically, a deviation between market price and NAV creates an opportunity for the ETF’s APs to pocket risk-free profits by selling or buying gold bullion and simultaneously buying or selling ETF shares.

All ETFs work the same way. That is, there’s nothing special about the way GLD works. The modus operandi ensures that the market prices of ETFs usually track their NAVs very closely.

Why, then, does the following chart show a long-term positive correlation between the gold price and GLD’s bullion inventory?

Because traders of GLD shares tend to get more optimistic about gold’s prospects and buy more aggressively AFTER the gold price has risen, causing GLD’s market price to rise relative to its NAV and prompting arbitrage that results in the addition of bullion to the ETF’s inventory. And because traders of GLD shares tend to become more pessimistic about gold’s prospects and sell more aggressively AFTER the gold price has fallen, causing GLD’s market price to fall relative to its NAV and prompting arbitrage that results in the removal of bullion from the ETF’s inventory. The correlation is far from perfect, because GLD traders won’t always become increasingly optimistic in reaction to a price rise or increasingly pessimistic in reaction to a price decline.

gold_GLDinv_280116

A final point worth making is that the annual change in GLD’s bullion inventory has always been very small relative to the total size of the gold market. Given the size of the total aboveground gold supply, there is very little chance that a few hundred tonnes per year moving into or out of GLD’s coffers could have a significant effect on the price.

So, the answer to the question “What do changes in GLD’s bullion inventory tell us about the future gold price?” is: nothing.

Print This Post Print This Post

The original Fed versus today’s Fed

January 26, 2016

In a recent blog post, Martin Armstrong wrote: “This constant attack on central banks is really hiding what the problem truly is — government. When the Fed was created, it “stimulated” the economy by purchasing corporate paper. The Fed was NEVER intended to buy government bonds. The politicians did that for World War I and never returned it to its purpose.” That’s not entirely true. Also, it’s naive to believe that the Fed would benefit the overall economy if it were restricted to its originally-intended purpose.

Contrary to Mr. Armstrong’s assertion, the Federal Reserve Act of 1913 actually does enable the Fed to buy government paper. Specifically, Section 14 of the Act states:

Every Federal reserve bank shall have power … [to] buy and sell, at home or abroad, bonds and notes of the United States, and bills, notes, revenue bonds, and warrants with a maturity from date of purchase of not exceeding six months, issued in anticipation of the collection of taxes or in anticipation of the receipt of assured revenues by any State, county, district, political subdivision, or municipality…

More generally, the Federal Reserve Act gave Federal Reserve banks the power to purchase short-term commercial paper (bills of exchange) and short-term government paper, and to set the discount rates associated with these purchases.

Secondly, the whole concept of economic stimulation by central banks in general and the Fed in particular is one of world history’s greatest-ever cases of mission creep. A central bank cannot possibly stimulate an economy by lowering interest rates and creating money; all it can do is distort an economy and exacerbate the boom-bust cycle. Although the theoretical framework had not yet been fully developed by the likes of Ludwig von Mises, this was generally known by economists at the time of the Fed’s establishment in 1913 and explains why there was no mention in the Federal Reserve Act of the Fed taking actions in an effort to modulate the pace of economic growth. Unfortunately, economics is the one science that has taken a giant step backwards over the past 100 years. Whereas there was originally no intention of having the Fed interfere with market rates of interest and react in a counter-cyclical manner to shifts in economic activity, most economists can no longer even envisage an economy that is free from central-bank manipulation.

Thirdly, while it would be a great improvement if the Fed were limited by the rules that originally governed its actions, it is important to understand that the problems (the periodic bank runs and financial crises) that the Fed was set up to address are the result of fractional reserve banking. Rather than eliminate fractional reserve banking, which would have been the correct solution, a central bank was established as a work-around. This is mainly because some of the most powerful and influential people in the country were bankers. Not surprisingly, most bankers like having the legal power to create money out of nothing.

My final point is that the Federal Reserve Act of 1913 was a foot in the economic door. Once the foot was in the door it was always going to be just a matter of time before the entire body had wormed its way in. The reason is that the powers of central banks grow in the same way as the powers of governments, with each intervention leading to problems that create the justifications for more interventions and with the occasional crisis providing the justification for a quantum leap in power. To put it succinctly, the mission creep was inevitable.

Print This Post Print This Post

How much longer will the gold-mining bear market last?

January 25, 2016

(This post is an excerpt from a recent TSI commentary.)

Intermediate-term rallies in the gold-mining sector can happen during general equity bull markets and general equity bear markets, but on a long-term basis the gold-mining sector trends in the opposite direction to the broad stock market. An implication is that to get a new bull market in gold-mining stocks there will probably have to be a new broad-based equity bear market.

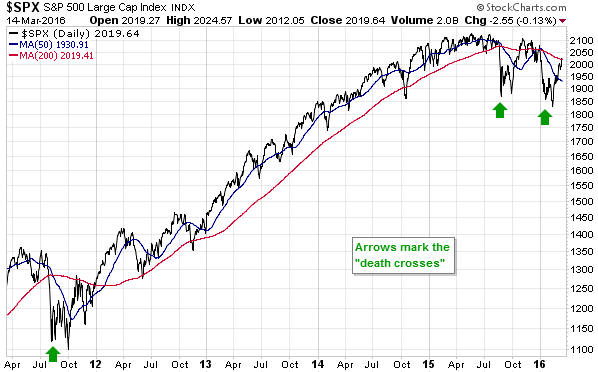
A good argument could be made that an equity bear market got underway last July, but at this stage the vast majority of market participants still believe that the bull market is intact. In general, people are very nervous about the short-term while remaining optimistic about the stock market’s long-term prospects. What would shake the long-term optimism of a critical mass of investors?

Based on what happened in 2000, an SPX break below the August-2015 low that was not quickly reversed would probably do it. This is the point we are trying to make with the following chart comparison. The chart compares the HUI and the SPX during the 12-month period beginning March-2000, or the 12-month period commencing just prior to the start of a cyclical stock-market decline.

Notice that the SPX bear market began with a sharp decline from a March high to an April low, after which there was a 4-5 month period of choppy trading that resulted in a test of the March high. At the time the March high was being tested hardly anyone believed that a bear market was underway. The market then began to trend downward and in October the SPX traded below its April low, but the downside breakout was quickly negated and there was a collective sigh of relief. It was still apparent to almost all market participants that they were dealing with a bull-market correction. Then, in November, the SPX again breached its April low and the breakout was not quickly negated. This was the point of recognition — the point when a critical mass of investors came to suspect that an equity bear market was in progress. This was also the point when the gold-mining sector commenced a bull market.

One of the reasons that the bear market in the gold-mining sector has been unusually long is that the general equity bull market has been unusually long. The general equity bull market is probably over, but very few people know it yet. Enough people to provoke a major trend change in the gold-mining sector will probably know it after the SPX makes a sustained break below the August-2015 low.

Print This Post Print This Post

Gold miners hiding poor cost control

January 23, 2016

Anyone who closely follows the mining industry would be well aware that gold producers operating in Australia and Canada were given a large bottom-line boost over the past 18 months by large declines in the Australian Dollar (A$) and the Canadian Dollar (C$). In some cases, the favourable exchange-rate movements are hiding poor cost control.

Looking at the situation from one angle, the financial boost stems from a relatively high selling price for gold in local currency terms. Looking at it from a different angle, the financial boost stems from a lower reported cost when costs are converted to US dollars. For example, if a Canada-based gold producer has a stable cost per ounce in C$ terms during a year when the average C$/US$ rate falls by 10%, then in US$ terms its costs have declined by 10%. In such cases the decline in the US$ cost/ounce shouldn’t be portrayed as if it were due to smart management, but, perhaps not surprisingly, some management teams have given themselves public ‘pats on the back’ for cost improvements that were solely the result of the change in the exchange rate.

The example I’ll highlight is Lakeshore Gold (LSG), a junior gold producer operating in Canada. I’m picking on LSG because it’s a stock that almost everyone loves at the moment. I quite like it too, although I currently don’t own it and wouldn’t buy it at the current price.

All the information needed to figure out LSG’s cost performance in local currency (C$) terms is available in the financial statements issued by the company, but in its press releases LSG usually reports cost/ounce figures in US dollars only. For example, for 2014 it reported an AISC (all-in sustaining cost) of US$872/oz and for 2015 it reported an AISC of US$870/oz, which superficially looks like, and is certainly portrayed by the company as, evidence of good cost control. However, almost all of LSG’s costs are C$-denominated and the average C$/US$ exchange rate was about 13% lower in 2015 than it was in 2014. This means that LSG’s cost/ounce in US$ terms got a 13% benefit from 2014 to 2015, or, to put it another way, a stable cost/ounce performance in US$ terms masks a double-digit cost/ounce increase in C$ terms.

A similar conclusion (a double-digit deterioration in LSG’s mining efficiency from 2014 to 2015) is reached if the operating cost/ounce is determined by dividing the total C$-denominated production cost by the number of ounces produced.

The stock market often doesn’t care about declining efficiency as long as the bottom-line is improving or is expected to improve, but it’s something that investors should be aware of.

Print This Post Print This Post

Swiss to vote on stopping banks from counterfeiting money

January 21, 2016

The Swiss Constitution contains something called the Volksinitiative (Peoples’ Initiative) that enables Swiss citizens to launch a referendum aimed at changing specific provisions within the Constitution. Launching the referendum requires the collection of 100,000 valid signatures in support of a “yes” vote within an 18-month period, after which the proposed constitutional change gets put to a national vote. A particularly interesting proposal has garnered the required signatures and will be put to a national vote within the next couple of years (probably in 2017). I’m referring to the Vollgeld Initiative, a proposal to eliminate the power of commercial banks to lend new money into existence.

In most countries around the world, commercial banks have the power to create new money by making loans. The process is called fractional reserve banking and has been around for hundreds of years. It has also been the root cause of the boom-bust cycle and economy-wide financial crises for hundreds of years. Furthermore, there is nothing beneficial about the process to the economy as a whole, although having the ability to create money out of nothing certainly helps banks to expand their balance sheets.

Due to the economic problems caused by allowing banks to create money and the fact that it is unjust for banks to have special privileges under the law, voting “yes” to this proposal would be a step in the right direction. However, it would only be a small step, because the Swiss National Bank (SNB) would still have the power to create an unlimited amount of money out of nothing and the government would decide how the new money was introduced into the economy. In other words, the commercial banks end up with less power (good) while the central bank and the government end up with more power (bad).

That the framers and supporters of the Vollgeld Initiative don’t perceive a major problem with increasing the government’s control over money indicates that they have far too much trust in government and don’t have a good understanding of how monetary inflation affects the economy.

Print This Post Print This Post