Blog 2 Columns

Bearish divergences at gold-mining bottoms

August 11, 2015

A bullish divergence between the gold-mining sector of the stock market, as represented by the HUI and/or the XAU, and gold bullion involves the gold-mining sector having an upward bias while gold bullion has a downward bias or the gold-mining sector making a higher low while the bullion market makes a lower low. However, bullish divergences often don’t happen around major price bottoms. In fact, it is not uncommon for a major price bottom in gold-related investments to be preceded by a bearish divergence between the gold-mining indices and the metal. To be more specific, it is not uncommon for the gold-mining indices to be weak relative to gold bullion right up to the ultimate price bottom, at which point they suddenly become relatively strong.

Here are charts showing two historical examples of what I am referring to, either of which could be relevant to the present situation. The first chart shows the continuing downward bias in the XAU along with an upward bias in the US$ gold price in the weeks leading up to the XAU’s July-1986 bottom. The July-1986 bottom was followed by a huge multi-quarter rally in the gold-mining sector. The second chart shows the relentless decline in the HUI along with a flat gold price in the weeks leading up to the HUI’s November-2000 bottom. The November-2000 bottom was also followed by a huge multi-quarter rally in the gold-mining sector. The rally from the July-1986 bottom turned out to be the bear-market variety whereas the rally from the November-2000 bottom turned out to be the first leg of a new bull market, but from a practical speculation perspective an X% gain in a bear market is just as good as an X% gain in a bull market.

XAU_1986_110815

HUI_2000_070815

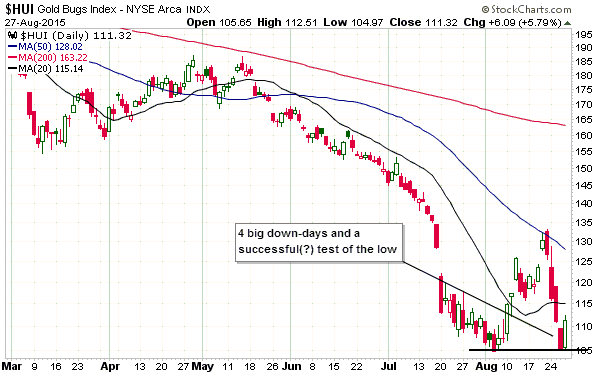
For comparison purposes, here is a chart showing the present situation.

HUI_gold_110815

It’s obviously too soon to know if the 10th August rebound in the gold-mining sector marked the start of a multi-quarter rally or even a 1-2 month rally, but the potential is there.

Print This Post Print This Post

Can the US economy survive more of the Fed’s monetary support?

August 8, 2015

This post is a slightly-modified excerpt from a recent TSI commentary.

Everybody knows that the Fed will eventually hike its targeted interest rate. When it comes to rate hikes, the only unknowns involve timing. What hardly anybody knows is that the Fed’s interest-rate suppression has damaged the economy and that the longer it continues, the weaker the economy will get.

Based on the wording of last week’s FOMC statement it is still likely, but far from a certainty, that the first rate hike will happen in September. That is, the timing of the Fed’s first rate hike remains unknown. The bigger unknown, however, is the timing of the Fed’s second rate hike. The reason is that there could be a large gap between the first and second hikes as a jittery Fed takes its time assessing the effects of the first hike. It could also be a case of “one and done”.

There have recently been numerous comments in the press to the effect that the Fed should stay with its zero% target, the reasoning being that the US economy is not yet strong enough to cope with even the smallest of rate hikes. This is downright weird, given that the economy is supposedly now 6 years into a recovery from the 2007-2009 recession. Just to be clear, I am referring to comments that there SHOULD be no rate hike in the near future, not to comments that there WILL be no rate hike in the near future. The first type of comment is a policy recommendation based on the wrongheaded theory that keeping the Fed Funds Rate at zero will help the economy, whereas the second type of comment is based on the recognition that the Fed’s senior management is guided by wrongheaded theory.

Not to put too fine a point on it, only someone who is economically illiterate could believe an economy can be helped by forcing the risk-free short-term interest rate down to zero and holding it there for years. The reality is that when a central planner distorts price signals it causes investing errors in the affected parts of the economy, and when a central planner distorts the most important of all prices (the price of credit) it leads to investing errors across the entire economy. Many economists, and as far as I can tell all Keynesian economists, haven’t figured this out because their analyses are based on models that treat the economy as if it were an amorphous mass instead of what it is — an extremely complex network comprised of millions of individuals making decisions for their own reasons.

Strangely, the commentators on the financial world who claim that the Fed should continue its Zero Interest Rate Policy haven’t put two and two together. They haven’t twigged that it’s not a fluke that the greatest experiment in money-pumping and interest-rate suppression in the Fed’s history coincided with the weakest post-recession recovery since the 1930s. It’s not a fluke because the extraordinary stimulus is the main cause of the apparent inability of the economy to get out of its own way. A former Fed chairman (now blogger) and current Fed officials routinely take bows for having brought the economy back to health, and yet over the past three years the compound annual growth rate of real US GDP has been slightly less than 2%/year using the government’s estimate of “inflation” and probably around 0%/year using a more realistic estimate of “inflation”. And this 3-year period should have been the sweet spot of the post-2009 economic expansion!

To be fair, the failure to link the weakness of the recovery with the dramatic scale of the policy response is not actually strange. It is, in fact, completely understandable. After all, if the economic model to which you are totally committed is based on the assumption that money-pumping and interest-rate suppression give the economy a sustainable boost, then an unusually weak economy in the wake of aggressive intervention of this nature can only mean two things. It can only mean that the situation would have been even worse without the intervention and that the problem was too little, not too much, monetary accommodation.

It’s testament to the resilience of whatever capitalist elements remain that the Fed hasn’t yet driven the US economy into the ground. There must, however, be a limit to the amount of monetary accommodation (that is, to the amount of price falsification) that the economy can withstand. I wonder what that limit is. Unfortunately, by the looks of things we are going to find out.

Print This Post Print This Post

The amazing inability to see the Fed’s money creation

August 5, 2015

The belief that the Fed’s QE (Quantitative Easing) does not directly boost the US money supply remains popular, even though it is obviously wrong. This is remarkable. It’s even more remarkable, however, that this wrongheaded belief is dearly held by some analysts who are generally astute, a fact I was reminded of when reading a recent post by Doug Noland.

The above-linked Noland post contains the following quote from Russell Napier. The quote is extraordinary due to a) the large number of errors that have been crammed into a few lines, b) the supreme confidence with which blatantly-wrong information is stated, and c) the fact that Russell Napier usually comes across as a smart analyst.

Most investors still believe that we live in a fiat currency world. They believe central bankers can create as much money as they believe to be necessary. Such truths are on the front page of every newspaper, but they may contain just as much truth as the headlines of their tabloid cousins. A belief in this ability to create money is the biggest mistake in analysis ever identified by this analyst. The first reality it ignores is that money, the stuff that buys things and assets, is created by an expansion of commercial bank, and not central bank, balance sheets. The massively expanded central bank balance sheets have not lifted the growth in broad money in the developed world above tepid levels. Until that happens, developed world monetary policy must be regarded as tight and not easy.

This quote is a mindboggling display of ignorance regarding the mechanics of the Fed’s QE, but Doug Noland describes it as “thoughtful and important analysis”. As they say in Thailand, oh my Bhudda! Doug Noland, another smart analyst, apparently also labours under false beliefs regarding the relationship between the Fed’s QE and the US money supply.

The Fed’s money-creation process is not that complicated. There’s certainly no good reason why professional financial-market analysts couldn’t or shouldn’t be familiar with it. I explained the process in some detail in a blog post on 16th February.

Moreover, even an analyst who doesn’t understand the mechanics of the QE process should be able to see, via a quick look at the money-supply and bank credit data, that there has been a lot more money creation in the US over the past several years than can be explained by the expansion of commercial bank balance sheets. For example, the red line on the following chart shows that from the beginning of 2009 through to the end of 2011 the total quantity of US commercial bank credit grew by only $100B (from $9.3T to $9.4T) while the blue line on the chart shows that over the same 3-year period the US money supply (currency in circulation outside the banking system + commercial-bank demand deposits + commercial-bank savings deposits) grew by $2.4T. If not from the Fed, where did the $2.3T of money-supply expansion that cannot be explained by commercial-bank credit expansion come from?

TMS_bankcredit_050815

Not coincidentally, the amount by which the increase in commercial-bank credit falls short of the increase in the money supply is approximately the same as the increase in Fed credit. This is not a coincidence because the Fed created the money.

Print This Post Print This Post

The gold supply-demand nonsense is relentless

August 4, 2015

In a blog post a couple of weeks ago I noted that it’s normal for large and fast price declines in the major financial markets to be accompanied by unusually-high trading volumes, meaning that it’s normal for large and fast price declines in the major financial markets to be accompanied by increased BUYING. I then wondered aloud as to why it is held up as evidence that something nefarious or strange is happening whenever an increase in gold buying accompanies a sharp decline in the gold price. Right on cue, ZeroHedge.com (ZH) has just published an article marveling — as if it were an inexplicable development — at how the recent sharp decline in the gold price was accompanied by an increase in buying.

As is often the case in the realm of gold-market analysis, the ZH article incorrectly conflates volume and demand. The demand for physical gold must always equal the supply of physical gold, with the price rising or falling by the amount needed to maintain the balance. If sellers are more motivated than buyers, then price will have to fall to restore the balance. The key point to understand here is that for every buyer there must be seller, and vice versa, so the purchase/sale of gold does not indicate a change in overall demand — it only indicates a fall in demand on the part of the seller and an exactly offsetting increase in demand on the part of the buyer. It is also worth noting — even though it should be obvious — that demand for physical gold cannot be satisfied by paper gold.

Trading in paper gold (gold futures, to be specific) clearly does have an effect on the price at which physical gold changes hands. The paper and physical markets are inextricably linked, but this link does not make it possible for the demand for physical gold to rise relative to the supply of physical gold in parallel with a falling price for physical gold.

What happens in the real world is that when the futures market leads the physical market higher or lower it changes the spread between the spot price and the price for future delivery. For example, when the gold price is being driven downward by speculative selling in the futures market, the price of gold for future delivery will fall relative to the spot price. In a period when risk-free short-term interest rates are being pegged at or near zero by central banks, this can result in the spot price becoming higher than the price of gold for delivery in a few months’ time. This creates a financial incentive for other operators in the gold market to buy gold futures and sell physical gold. For another example, when the gold price is being driven upward by speculative buying in the futures market, the price of gold for future delivery will rise relative to the spot price. This creates a financial incentive for other operators in the gold market to sell gold futures and buy physical gold.

The bullion banks are the “other operators”. They tend to focus on trading the spreads between the physical and futures markets. In doing so they position themselves to make a small percentage profit regardless of the price trend and therefore tend to be agnostic with regard to the price trend.

After harping on about the dislocation between the physical and paper gold markets, a dislocation that doesn’t actually exist but makes for good copy in some quarters, the above-mentioned ZH article moves on to the level of the CME (often still referred to as the COMEX) gold inventory. To the sound of an imaginary drumroll, the author of the article breathlessly points out that the amount of “registered” gold at the COMEX has dropped to a 10-year low and that the amount of “open interest” in gold futures is now at a 10-year high relative to the amount of “registered” gold.

The information is correct, but isn’t relevant other than as a sentiment indicator. It’s a reflection of what has happened to the price over the past few weeks and the increase in negativity that occurred in reaction to this price move. It is not evidence of physical-gold scarcity.

I currently don’t have the time to get into any more detail on the COMEX inventory situation. However, if you are interested in delving a little deeper you could start by reading the July-2013 article posted HERE. I get the impression that this article was written in response to the scare-mongering that ZH was doing on the same issue two years ago.

Thanks largely to the unprecedented measures taken by the senior central banks over the past few years, there have been many strange happenings in the financial world. However, the increased buying of physical gold in parallel with a sharply declining gold price and the reduction in COMEX “registered” gold cannot be counted among them.

Print This Post Print This Post

Is the Fed privately owned? Does it matter?

August 3, 2015

The answer to the first question is ‘sort of’. The answer to the second question is no. The effects of having an institution with the power to manipulate interest rates and the money supply at whim are equally pernicious whether the institution is privately or publicly owned. However, if you strongly believe that the government can not only be trusted to ‘manage’ money and interest rates but is capable of doing so to the benefit of the economy, then please contact me immediately because I can do you a terrific deal on the purchase of the Eiffel Tower.

The fact is that the Federal Reserve would be a really bad idea regardless of whether it were privately owned or owned by the US government. The question of ownership is therefore secondary and the people who stridently complain about the Fed being privately owned are missing the critical point. In any case and as I explained in an article way back in 2007, the Fed is not privately owned in the true meaning of the word “owned”. For all intents and purposes, it is an agency of the US Federal Government.

In addition to the work of G. Edward Griffin referenced in my above-linked 2007 article, useful information about the Fed’s ownership can be found in a 2010 article posted at the Mises.org web site. This article approaches the Fed’s ownership and control from an accounting perspective, that is, by applying Generally Accepted Accounting Principles (GAAP), and concludes that:

…the Fed, when tested against GAAP as the Fed itself uses it in the Fed’s assessments of those it regulates, is a Special Purpose Entity of the federal government (or, according to the latest definition, is a Variable Interest Entity of the federal government). The rules of consolidation therefore apply, and the Fed must be seen as controlled by federal government, making it indivisibly part of the federal government. The pretence of independence is no more than that, a pretence.

There is, however, no denying that the banks have tremendous vested interest in influencing the policies of the Fed, nor that the power being so narrowly vested in the president makes him a special target for influence. Still, the power to control the Fed is not in the hands of its “owners” but firmly in the hands of the federal government and the president of the United States.

It is clear that the Fed was established by the government at the behest of bankers with the unstated aim of facilitating the expansions of the government and the most influential banks. It is effectively a government agency, but due to the influence that the large banks have on the government it will, if deemed necessary by the Fed Chairman, act for the benefit of these banks at the expense of the broad economy. The happenings of the past eight years should have left no doubt about this.

Print This Post Print This Post
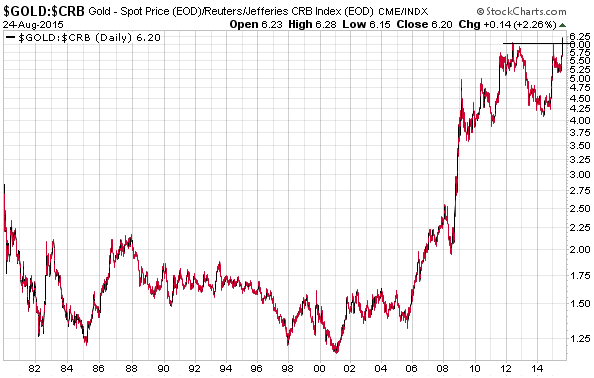
Steep price declines and increased buying often go together

July 25, 2015

In numerous TSI commentaries over the years I’ve written about the confusion in the minds of many analysts regarding what constitutes gold supply and the relationship between supply, demand and price in the gold market. I’ve also covered the issue several times at the TSI Blog, most recently on 24th June in the post titled “More confusion about gold demand“. I’m not going to delve into this subject matter again today other than to use the example of last Monday’s trading in GDX (Gold Miners ETF) shares to further explain a point made in the past.

On Monday 20th July the GDX price fell by about 10% on record volume of 170M shares. Since every transaction involves both a purchase and a sale, more GDX shares were bought last Monday than on any other single day in this ETF’s history. And yet, this massive increase in buying occurred in parallel with a large price decline. How could this be?

Obviously, the large price decline CAUSED the massive increase in buying. Many holders of GDX shares were eager to get out and the price had to fall as far as it did to attract sufficient new buying to restore the supply-demand balance.

It’s normal for large and fast price declines in the major financial markets to be accompanied by unusually-high trading volumes, meaning that it’s normal for large and fast price declines in the major financial markets to be accompanied by increased BUYING. Most people understand this. So why is it held up as evidence that something nefarious is happening whenever an increase in gold buying accompanies a large decline in the gold price?

I can only come up with two plausible explanations. One is that many analysts and commentators switch off their brains before pontificating about gold. The other is that the relationship between gold supply, demand and price is deliberately presented in a misleading way to promote an agenda. I suspect that the former explanation applies in most cases, meaning that in most cases there’s probably more ignorance than malice involved.

Print This Post Print This Post

Recommended Reading on the Iran Nuclear Treaty

July 23, 2015

Here are links to the two best articles I’ve read about the Iran nuclear treaty. The first is by David Stockman, an author, a blogger, a Wall Street veteran, and the Director of the Office of Management and Budget under President Ronald Reagan. The second is by Uri Avnery, a writer, the founder of the Gush Shalom peace movement, and a former member of Israel’s parliament. Although they tackle the issue from different perspectives, both articles are rich in historical information and insightful analysis. One thing Stockman and Avnery — and, as far as I can tell, everyone who is objective and well-informed on the subject — agree on is that Iran did not have a nuclear weapons program and probably had no intention of starting such a program.

http://davidstockmanscontracorner.com/all-praise-to-barrack-obama-hes-giving-peace-a-chance/

http://jewishbusinessnews.com/2015/07/17/uri-avnery-the-treaty/

Print This Post Print This Post
Beware of bogus “inflation” indices

July 22, 2015

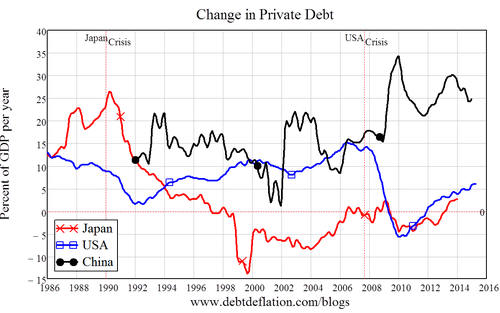
Every attempt to come up with a single number (a price index) that reflects the change in the purchasing power (PP) of money is bound to fail. The main reason is that disparate items cannot be added together and/or averaged to arrive at a sensible result. However, some price indices are less realistic than others. In particular, some well-meaning private-sector efforts to come up with a consumer price index (CPI) that does a better job than the official CPI have generated some of the least-plausible numbers.

One of the most popular alternatives to the official US CPI is the CPI calculated by Shadowstats.com. As I noted in a previous post, it always seemed to me that the Shadowstats number was derived by adding an approximately constant fudge-factor to the official (bogus) CPI to essentially arrive at another bogus number that, regardless of the message being sent by real-world experience, was always much larger than the official number. As I also noted at that time, economist Ed Dolan did some detective work to determine the cause of the strangely-large and fairly-constant difference between the Shadowstats number and the official number. It turned out that Shadowstats had made a basic calculation error that caused its version of the CPI to consistently be at least 4.5%/year too high even assuming the correctness of its own methodology.

Another alternative CPI is called the Chapwood Index. The components of this index were selected based on a survey of what Ed Butowsky’s friends and associates spend their money on (Ed Butowsky is the index’s creator). The prices of the 500 most commonly purchased items were then added together to generate the index. Not surprisingly, considering the methodology, the result is not a realistic measure of the change in the dollar’s PP or the cost of living. As evidence I point out that if the roughly 10%/year average increase in the general price level estimated by the Chapwood Index during 2011-2014 is correct, then the US economy’s real GDP must have been about 25% smaller at the end of 2014 than it was at the end of 2010*. In other words, if the Chapwood Index is an accurate reflection of PP loss then the US economy now produces about 25% less goods/services than it did four years ago. This is not remotely close to the truth.

When assessing the validity of economic statistics it’s important to use commonsense. A statistic isn’t valid just because it happens to be consistent with a narrative that you wholeheartedly believe.

*I arrive at this figure by approximately adjusting nominal GDP by the Chapwood Index, that is, by using the Chapwood Index as the GDP deflator.

Print This Post Print This Post