Looking at oil from different perspectives
Posted By Jacqui On October 25, 2021 @ 6:09 am In Uncategorized | Comments Disabled
[This blog post is a modified excerpt from a commentary published at TSI about two weeks ago. We've updated the charts and prices to reflect the current market situation.]
Today we’ll take a brief look at oil through three different lenses: The long-term price-action lens, the physical supply-demand lens and the macro-economic lens.
The following chart shows the significance of the US$76-$77 price level above which oil has moved over the past few weeks. This price level acted as support during large downward corrections in 2011-2012 and capped the 2016-2018 rally.
The move above major resistance is not a short-term buy signal, because the market is ‘overbought’ (which, by the way, doesn’t guarantee that the price will fall, but does mean that the risk of new buying is relatively high). However, it is a reward for those who added to their oil exposure when the commodity and the related equities were ‘oversold’ at various times over the past three months and is consistent with our view that the cyclical advance will extend into 2022.
With regard to likely future performance, of far greater importance than the break above long-term resistance is that the physical supply situation remains unusually ‘tight’. We know this is the case because strong backwardation (meaning: nearer-dated contracts are priced well above later-dated contracts) prevails in the oil futures market. This is evidenced by the downward slope on the following chart. Strong backwardation can only arise and be sustained in the oil market during a period when the demand for oil is high relative to the currently available supply.
The most recent data on the following chart is for the situation at 14th October 2021, but the futures curve continues to have a steep downward slope. For example, at the time of writing oil for delivery in December of this year is priced at $84.55, whereas oil for delivery in December-2022 is priced at $72.58 and oil for delivery in December-2023 is priced at only $66.56.
Note that the prices of oil futures are NOT forecasts of where the spot price will be in the future. Instead, the futures price relative to the spot price reflects the cost of storage. Since the cost of storage is always above zero, the futures price will always be higher than the spot price unless there is a current shortage of the physical commodity.
 [2]
[2]
Chart source: https://www.erce.energy/graph/wti-futures-curve/ [3]
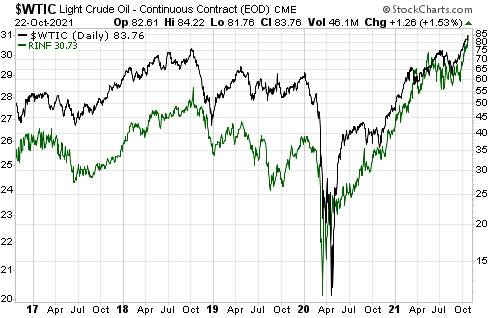
Our last chart shows that the oil price and the Inflation Expectations ETF (RINF) usually trend in the same direction. This positive correlation is part and parcel of a broader positive correlation between commodity prices (as represented by indices such as GNX) and inflation expectations.
Both oil and inflation expectations have resumed their cyclical upswings following corrections during the second and third quarters of this year.
At the moment, the price action, the supply-demand fundamentals and the macro-economic backdrop (as reflected by inflation expectations) are saying the same thing. They are all saying that we should expect the oil price to continue its upward trend.
Article printed from TSI Blog: https://tsi-blog.com
Click here to print.

