Monetary Inflation Roundup
Posted By Steven Saville On May 14, 2019 @ 1:46 am In Uncategorized | Comments Disabled
[This blog post is an excerpt from a recent TSI commentary]
Here is our monthly update on what’s happening on the monetary inflation front in a few different regions/countries.
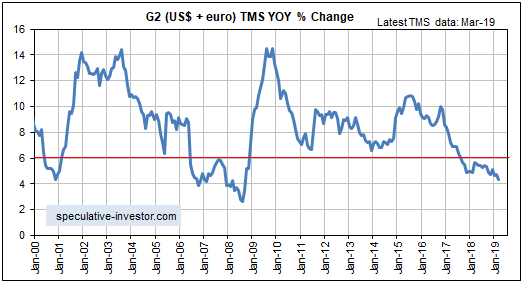
The G2 (US plus euro-zone) monetary inflation rate dropped to a 10-year low in March-2019 and has now spent 19 months below the boom-bust threshold of 6%. Refer to the following chart for details.
The low rate of G2 monetary inflation stems from the very low rate of money-supply growth in the US. During March the year-over-year (YOY) rate of growth in euro supply was 7.6%, which although well down from a 2014 peak of 14% is still quite high. The rate of growth in US$ supply, however, was only 1.8%.
The slow (by modern standards) rate of G2 money-supply growth boosts the risk that a global recession will begin in 2019, but, as noted in the past, the monetary inflation rate is a long-term indicator that leads economic and financial-market conditions by amounts of time that can vary substantially from one cycle to the next. When attempting to predict the start time of the next recession we therefore rely on other leading indicators, three of which were discussed in last week’s Interim Update.
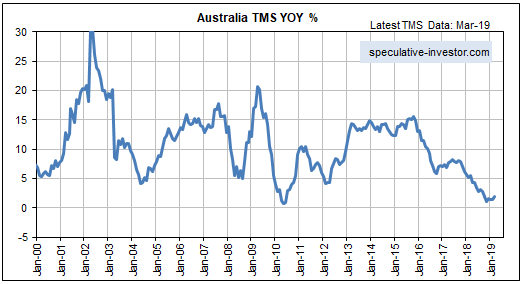
Australia’s monetary inflation rate has picked up a little over the past few months, but the country remains on the verge of monetary deflation.
The very slow money-supply growth has had an effect on Australia’s property market, in that over the past 12 months residential property prices have fallen by an average of 6.9% on a nationwide basis and 10.9% in Sydney (the largest and most expensive city in Australia). Refer to the article posted HERE [1] for more detail.
Actually, the decline to near zero in Australia’s monetary inflation rate is both a cause and an effect of the slight (to date) deflation of the property investment bubble. Commercial banks have been making it more difficult for house buyers to obtain credit, leading to a pullback in prices and a slowdown in the pace at which new money is created.
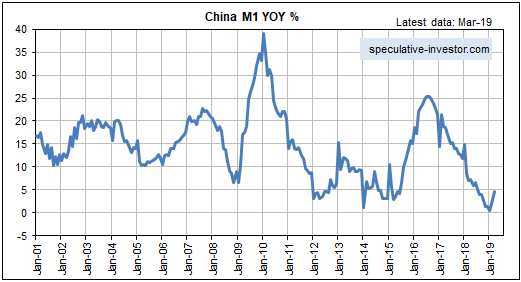
In January-2019 the year-over-year (YOY) growth rate of China’s M1 money supply dropped to its lowest level since 1989. There was an insignificant up-tick in February, but the recent attempts by China’s government to promote credit expansion started to ‘bear fruit’ in March. Refer to the following chart for details.
We wonder if this is too little too late to kick-start a new surge in the demand for industrial commodities.
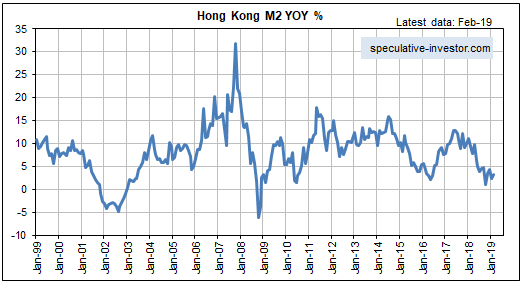
Hong Kong hasn’t escaped the general monetary-inflation slowdown. As illustrated below, the YOY rate of growth in HK’s M2 money supply has languished near a 10-year low in the 1%-4% range over the past several months.
Remarkably, HK’s low monetary inflation rate is yet to have a pronounced effect on the world’s most expensive real estate. Property prices dropped in HK during August-December of last year, but they rose in January and the majority view is that a rise to new highs is in store [2].
Due to the monetary backdrop, we think there’s a high risk of a double-digit decline in HK property prices over the next 12 months.
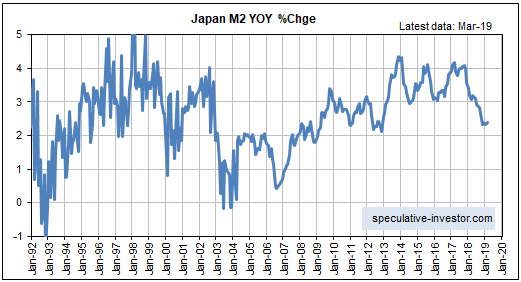
Almost everyone knows that the Bank of Japan (BOJ) has pumped a huge amount of money into the Japanese economy, so the lack of “price inflation” in Japan is something of a quandary. Analysts have let their imaginations run wild in an attempt to explain this strange set of circumstances, and the situation in Japan has even been cited as proof that increasing the money supply doesn’t cause prices to rise. However, anyone who didn’t blindly assume that the BOJ’s actions were leading to rapid money-supply growth and instead took the trouble to check what was actually happening to Japan’s money supply would quickly realise that explaining Japan’s lack of “price inflation” requires no stretch of the imagination. The fact is that Japan’s monetary inflation rate over the past 25 years has been consistent with an “inflation” rate of approximately zero.
The persistently low rate of monetary inflation in Japan is illustrated by the following chart. The chart shows that the YOY rate of increase in Japan’s M2 money supply averaged about 2% over the past 27 years and about 2.5% over the past 10 years. It is currently about 2.4%. Assuming productivity growth of 2%-3%, these money-supply figures are consistent with a flat general price level.
Note that QE in Japan is different from QE in the US. When the Fed implements QE it boosts the supply of bank reserves and the supply of money on a one-for-one basis (bank reserves aren’t counted in the money supply), but the BOJ’s QE adds far more to bank reserves than to the money supply. Note also that the Fed’s QE created a lot less “price inflation” than many people were expecting for the reasons outlined HERE [3].
The Japanese economy has benefited from the persistently slow rate of monetary inflation and the resulting stability of the currency, but at the same time it has been hurt by the massive diversion of resources to the government. The net result is an economy that isn’t exactly vibrant, but also isn’t that bad.
To summarise the above information, the pace at which new money is being created around the world remains unusually slow.
Article printed from TSI Blog: https://tsi-blog.com
Click here to print.