Inflation/deflation and the desire to avoid short-term pain

May 16, 2017

The desire to avoid short-term pain is a powerful motivator. Even in cases where it is known that the steps taken to avoid pain in the short-term will lead to greater pain in the distant future, people will often choose the path that entails lesser short-term pain. Also, there’s often the hope that if pain is postponed for long enough then something will spring up to circumvent the need to experience the pain. The relevance to the inflation-deflation issue is that the long-term cure for an economy suffering from the bad effects of high monetary inflation involves stopping the inflation, but stopping the inflation always results in short-term pain.

Nowadays, people look back at the devastating inflation that occurred in Germany in the early 1920s and think: “How could the central bankers of that era have been so stupid? There’s no way that the stewards of today’s major currencies would make the same mistakes!” In real time, however, the gross stupidity of the German central bank’s actions was only apparent to a small number of economists. At each step along the way to total monetary collapse, the pain involved in stopping the money-printing was weighed against the cost of continuing the inflation and it always appeared to make sense to continue the inflation for just a little longer.

It’s very unlikely that a hyperinflationary collapse will happen in any of the major industrialised economies within the next two years, but having watched the Bernanke-Yellen Fed, the Draghi ECB and the Kuroda BOJ in action it is not hard for me to imagine such a collapse eventually happening. I cite, for instance, the fact that ECB chief Mario Draghi is arguing the need to sustain an aggressive monetary “stimulus” program even though it should be clear to anyone with eyes and a modicum of economics knowledge that the “stimulus” implemented to date has been an abject failure. I also cite the very popular and yet completely wrongheaded tendency to measure the success of a policy by the stock market’s response to the policy. By this measuring stick, pumping new money into the economy will usually look smart. Lastly, I cite the widely-held conviction that it is up to the central bank and the government to do something ‘stimulative’ whenever signs of economic weakness emerge, despite the mountain of evidence that earlier attempts to ‘do something’ resulted in bad unintended consequences. The sad truth is that the framers of monetary and fiscal policies are strongly influenced by faulty economic theory and short-term thinking, and that’s not going to change anytime soon.

The day might come when the costs of continuing the inflation are so widely understood that there exists the political will to bring the money-depreciating policies to an end, but don’t hold your breath waiting for that day. If the day does come it will likely be years from now. In the mean time, the desire to avoid short-term pain will reign supreme.

Print This Post Print This Post

Gold, Commodities and Economic Confidence

May 10, 2017

To believe that the gold market is influenced by the manipulation of a banking cartel to the extent that the gold price doesn’t reflect the true fundamental drivers it is necessary to have almost no understanding of what those price drivers are and how they should affect the market. There are many fundamental relationships between gold and other markets that I could show in chart form to support this statement, but in this post I’ll focus on a chart that illustrates the relationship between gold, commodities and economic confidence.

The change in the average credit spread, that is, the change in the average difference between yields on relatively high-risk and relatively low-risk bonds, is a good indicator of changes in economic confidence. Specifically, when credit spreads are widening it means that confidence is on the decline and when credit spreads are narrowing it means that confidence is on the rise.

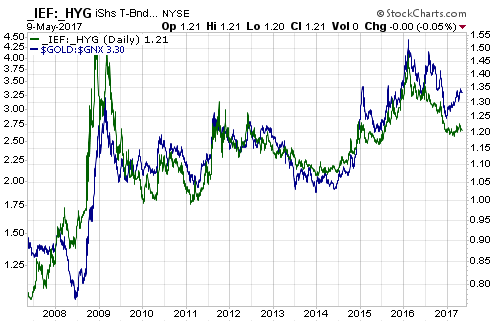
Fortunately, there are a number of easy and accurate ways of determining whether credit spreads are widening or narrowing. One that I like to use is the IEF/HYG ratio. This ratio is the price of an ETF that holds 7-10 year Treasury securities divided by the price of an ETF that holds junk bonds of similar duration. A rising IEF/HYG ratio indicates widening credit spreads (falling economic confidence) and a falling IEF/HYG ratio indicates narrowing credit spreads (rising economic confidence).

Those who understand gold’s role in the financial world would know that the gold price should generally trend upward relative to the prices of most other commodities (as represented by a broad-based commodity index such as GNX) when economic confidence is on the decline and trend downward relative to the prices of most other commodities when economic confidence is on the rise. Absent manipulative forces that prevent gold from behaving in the proper way, what we should therefore see is a positive correlation between the gold/commodity ratio and the IEF/HYG ratio. This is exactly what we do see in the following chart.

goldGNX_IEFHYG_090517

All markets are, always have been and always will be manipulated, but this generally doesn’t prevent them from responding in a reasonable way to the genuine fundamentals over multi-month periods.

Print This Post Print This Post

The insidious effects of monetary inflation

May 9, 2017

Most people with a basic grounding in economics know that increasing the supply of money leads to a fall in the purchasing power of money. However, this is usually as far as their understanding goes and explains why monetary inflation is generally not unpopular unless the cost of living happens to be rising rapidly. Monetary inflation would be far more unpopular if its other effects were widely understood.

Here are some of these other effects:

1. A greater wealth gap between rich and poor. For example, monetary inflation is probably a large part of the reason that the percentage of US household wealth owned by the richest 0.1% of Americans has risen from 7% to 23% since the mid-1970s and is now, for the first time since the late-1930s, greater than the percentage US household wealth owned by the bottom 90%. Inflation works this way because asset prices usually respond more quickly than the price of labour to increases in the money supply, and because the richer you are the better-positioned you will generally be to protect yourself from, or profit from, rising prices.

2. Large multi-year swings in the economy (a boom/bust cycle), with the net result over the entire cycle being sub-par economic progress due to the wealth that ends up being consumed during the boom phase.

3. Reduced competitiveness of industry within economies with relatively high monetary inflation rates, due to the combination of rising material costs and distorted price signals. The distortion of price signals caused by monetary inflation is very important because these signals tell the market what/how-much to produce and what to invest in, meaning that there will be a lot of misdirected investment and inefficient use of resources if the signals are misleading.

4. Higher unemployment (an eventual knock-on effect of the misdirection of investment mentioned above).

5. A decline or stagnation in real wages over the course of the inflation-generated boom/bust cycle. I point out, for example, that real median household income in the US was about the same in 2015 as it was in 1998 and that the median weekly real earnings level in the US was about the same in Q3-2016 as it was in Q1-2002.

Real earnings decline or stagnate because during the boom phase of the cycle wages will usually be near the end of the line when it comes to responding to the additional money, whereas during the bust phase the higher unemployment rate (the excess supply of labour) will put downward pressure on wages.

Note that while a lower average real wage will partially offset the decline in industrial competitiveness resulting from distorted price signals, it won’t result in a net competitive advantage. It should be intuitively obvious — although to the Keynesians it apparently isn’t — that an economy could never achieve a net competitive advantage from what amounts to counterfeiting on a grand scale. In any case, what sort of economist would advocate a course of action that firstly made the economy less efficient and secondly tried to make up for the loss of efficiency by reducing living standards (a reduction in real wages equals a reduction in living standards).

6. More speculating and less saving. The greater the monetary inflation, the less sense it will make to save in the traditional way and the more sense it will make to speculate. This is problematic for two main reasons. First, saving is the foundation of long-term economic progress. Second, most people aren’t adept at financial speculation.

7. Weaker balance sheets, because during the initial stages of monetary inflation — the stages that occur before the cost of living and interest rates begin to surge — people will usually be rewarded for using debt-based leverage.

8. Financial crises. Rampant mal-investment, speculation and debt accumulation are the ingredients of a financial crisis such as the one that occurred during 2007-2009.

The above is a sampling of what happens when central bankers try to ‘help’ the economy by creating money out of nothing.

Print This Post Print This Post

The only problem with Keynesian theory is that it is completely wrong

May 5, 2017

Governments and central banks have invoked the writings of J.M. Keynes to justify the massive increases in government spending and monetary inflation that have occurred over the past 9 years. However, some of Keynes’s apologists have pointed out that the famous British economist would not have agreed with many of the policy responses for which his work has provided the intellectual justification. They point out, for example, that Keynes only advocated temporary increases in government spending as a means of absorbing shocks to the economy, and that he was dead against currency debasement and the creation of structural deficits. The problem, though, isn’t that Keynes’s theory has been applied to an unreasonable extreme; the problem is that the theory is completely wrong.

For starters, the laws of economics always apply, so if greater government deficit-spending really did act to strengthen the economy during recessions then it would also act to strengthen the economy during the good times. On the other hand, if greater government deficit-spending hurt the economy during the good times then it would also hurt the economy during recessions. The point is that there isn’t one set of laws that applies during periods of growth and another set that applies during periods of contraction.

Secondly, the concept that the government can provide a sustainable boost to the economy by increasing its spending is based on the fallacy that increased consumer spending causes the economy to grow. It causes GDP to increase due to the misleading way the GDP calculation is done, but for an increase in consumer spending to be sustainable it must be an effect of real growth; that is, it must follow an increase in production, which, in turn, must follow an increase in saving. Consumer spending is the caboose, not the engine.

Thirdly and as most people realise, the government usually does things much less efficiently than the private sector. The fact is that government spending tends to involve a lot of wastage. This is not an issue for the true Keynesian because he views an increase in spending as an economic plus even if the spending is totally unproductive, but it should be an issue for a good economist.

Fourthly, the government doesn’t generate any real wealth of its own that can be spent in order to offset what’s happening in the private sector. Instead, everything the government spends must first be borrowed or stolen from the private sector. So, how can the private economy possibly be helped by the government increasing the rate at which it steals and borrows from the private sector?

Fifthly, recessions occur because of the widespread mal-investment prompted by the earlier expansions of the supplies of money and unbacked credit brought about by the central bank and the commercial banks. As a result of this mal-investment, the economy’s structure becomes distorted such that it is geared to produce too much of some things and not enough of others. Unfortunately, the Keynesians mislabel the distortion caused by inflation as an “output gap”, which they then cite as justification for more inflation and more government spending. To further explain, recessions are symptoms of the process via which an economy attempts to rid itself of the distortions caused by prior inflation and intervention. And yet, in its role as “economic shock absorber”, the central-planning team comprising the government and the central bank tries to sustain the distortions. How can this possibly be beneficial?

If an economy is strong enough it should be able to recover DESPITE the application of Keynesian remedies designed to smooth-out the transition to the next expansion, which is why the economy usually recovers. However, the economic structure will necessarily be weakened by each successive increase in government spending and each successive monetary-inflation-fueled boom until, eventually, the economy will be in such a weakened state that it will be unable to bounce back in the face of more Keynesian policies. That’s why the US economy’s recovery from the 2007-2009 recession has been ‘surprisingly’ lacklustre and why Japan’s economy now seems incapable of strong growth.

Hyperinflation* and/or a totalitarian state are the inevitable destinations if Keynes’s theories are relentlessly applied over the long term. The reason is that each round of policy mistakes creates the justification for more mistakes, setting in motion a downward spiral that will be inescapable as long as the perceived solution entails more of the same. The only unknown is how long it will take to reach one or both of these destinations.

*Just to be clear and as explained in a previous blog post, I have never been of the view that hyperinflation is an imminent threat to the US economy. The imminent threat is the continuing erosion of freedom as new interventions by the government are justified by the adverse consequences of earlier interventions.

Print This Post Print This Post

What should the gold/silver ratio be?

May 2, 2017

The price of gold is dominated by investment demand* to such an extent that nothing else matters as far as its price performance is concerned. Investment demand is also the most important driver of silver’s price trend, although in silver’s case industrial demand is also a factor to be reckoned with. In addition, changes in mine supply have some effect on the silver market, because unlike the situation in the gold market the annual supply of newly-mined silver is not trivial relative to the existing aboveground supply of the metal.

Given that the change in annual mine supply is irrelevant to the gold price and is not close to being the most important driver of the silver price, why do some analysts argue that the gold/silver ratio should reflect the relative rarities of the two metals in the ground and therefore be 10:1 or lower? I don’t know, but it isn’t a valid argument.

A second way of using relative rarity to come up with a very low gold/silver ratio is to assert that the price ratio should be based on the comparative amounts of aboveground supply. Depending on how the aboveground supplies are calculated, this method could lead to the conclusion that silver should be more expensive than gold. It would also lead to the conclusion that gold should be the cheapest of all the world’s commonly-traded metals, instead of the most expensive. For example, if gold’s relatively-large aboveground supply was a reason for a relatively low gold price then gold should not only be cheaper than silver, but also cheaper than copper.

Another argument is that the gold/silver ratio should be around 16:1 because that’s what it averaged for hundreds of years prior to the last hundred years. This is also not a valid argument, because changes in technology and the monetary system can cause permanent changes to occur in the relative values of different commodities and different investments. For example, when monetary inflation was constrained by the Gold Standard the stock market’s average dividend yield was always higher than the average yield on the longest-dated bonds, but the 1934-1971 phasing-out of the official link to gold permanently altered this relationship. In a world where commercial and central banks can inflate at will, the stock market will always yield less than the bond market (except when the central-bank leadership goes completely ‘off its rocker’ and implements the manipulation known as NIRP). This is because stocks have some built-in protection against inflation. The point is that the ratio of gold and silver prices during an historical period in which both metals were officially “money” does not tell us what the ratio should be now that neither metal is officially money and one of the markets (silver) has a significant industrial demand component.

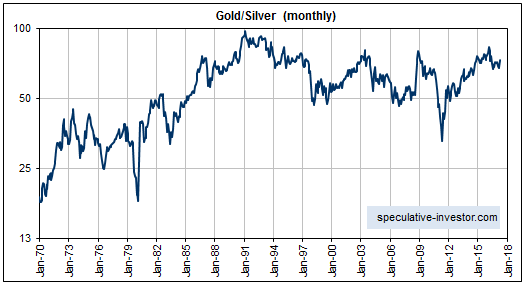
The global monetary system’s current configuration dates back to the early 1970s, when the last remaining official link between gold and the US$ was severed. This probably means that we can look at how gold and silver have performed relative to each other since the early 1970s to determine what’s normal and what’s possible. With reference to the following chart, here’s a summary of what happened during this period:

a) The gold/silver ratio spent the bulk of the 1970s in the 30-40 range, but broke out of this range to the downside during the second half of 1979 in response to massive accumulation of silver bullion and silver futures by the Hunt brothers.

b) The ratio dropped as low as 16:1 in January of 1980, but then returned to 40 in the ‘blink of an eye’ as rule changes by the commodity exchange created financial problems for the highly-geared Hunts and a commodity-investment bubble began to deflate.

c) During the second half of the 1980s the ratio trended upward as US financial corporations weakened. The ratio peaked at around 100 at the beginning of 1990s in parallel with a full-blown banking crisis that almost resulted in the collapse of some of the largest US banks.

d) The ratio trended lower throughout the 1990s as the banks recovered (with the help of the Fed) and financial assets trended upward.

e) From the late 1990s through to the beginning of 2011 the ratio oscillated between 45 and 80, with 80 being reached near the peaks of financial crises (early-2003 and late-2008) and 45 being reached in response to generally high levels of economic confidence.

f) In February of 2011 the ratio broke below the bottom of its long-term range and rapidly moved down to around 30. The huge price run-up in silver that led to this large/fast decline in the gold/silver ratio was fueled by the overt bullishness of a high-profile/well-heeled speculator (Eric Sprott) and by various rumours, including rumours of silver shortages and the unwinding of a price-suppression scheme led by JP Morgan. There were no silver shortages and there was no price-suppression scheme to be unwound, but as is often the case in the financial markets the facts didn’t get in the way of a good story.

g) The 2010-2011 parabolic rise in the silver price ended the same way that every similar episode in world history ended — with a price collapse.

h) Silver’s Q2-2011 price collapse set in motion a major, multi-year upward trend in the gold/silver ratio. In this case, the upward trend in the ratio was driven by the deflating of a commodity investment bubble and problems in the European banking industry. The ratio rose all the way to the low-80s and is still at an unusually-high level in the 70s.

gold_silver_010517

The gold/silver ratio’s performance over the past five decades suggests that the 45-60 range can now be considered normal, with moves well beyond the top of this range requiring a banking crisis and/or bursting bubble and moves well beyond the bottom of this range requiring rampant speculation focused on silver.

*In this post I’m lumping speculative, safe-haven and savings-related demand together under the term “investment demand”.

Print This Post Print This Post

Are rising nominal interest rates bullish or bearish for gold?

April 28, 2017

The short answer to the above question is that they are neither. Read on for the longer answer.

Consider what happened to nominal interest rates during the long-term gold bull markets of the past 100 years. Interest rates generally trended downward during the gold bull market of the 1930s, upward during the gold bull market of the 1960s and 1970s, and downward during the bull market of 2001-2011. History’s message, therefore, is that the trend in the nominal interest rate does not strongly influence gold’s long-term price trend.

History tells us that gold bull markets can unfold in parallel with rising or falling nominal interest rates, but this shouldn’t be interpreted as meaning that interest rates don’t affect whether gold is in a bullish or bearish trend. The long-term trend in the nominal interest rate is not critical; what is of great importance, as far as the gold market is concerned, is the REAL interest rate, with low/falling real interest rates being bullish for gold and high/rising real interest rates being bearish. For example, when gold was making huge gains during the 1970s in parallel with high/rising nominal interest rates, real interest rates were generally low. This is because gains in inflation expectations were matching, or exceeding, gains in nominal interest rates (the real interest rate is the nominal interest rate minus the EXPECTED rate of currency depreciation).

Very low real interest rates are artifacts of central banks, because in an intervention-free market all lenders would insist on a significant real return in exchange for temporarily relinquishing control of their money. In other words, “very low real interest rates” essentially means “very loose monetary policy”.

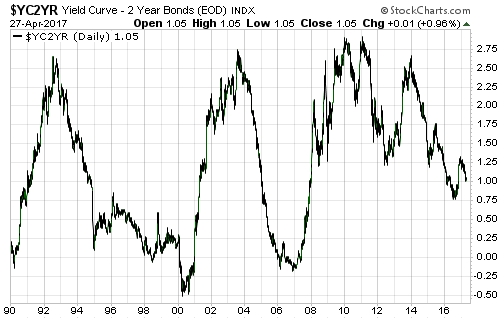
Something else that affects gold’s price trend is the difference between long-term and short-term interest rates (the yield-spread, or yield curve), with a rising yield-spread (‘steepening’ yield curve) being bullish for gold and a falling yield-spread (flattening yield curve) being bearish. It works this way because a rising trend in long-term interest rates relative to short-term interest rates generally indicates either falling market liquidity (associated with increasing risk aversion and a flight to safety) or rising inflation expectations, both of which are bullish for gold.

As is the case with the real interest rate, under the current monetary system the yield-spread tends to be a symptom of what central banks are doing. If money were free of central bank manipulation then the yield-spread would spend most of its time near zero (the yield curve would be almost horizontal) and would experience only minor fluctuations, but thanks to the attempts by central banks to ‘stabilise’ the financial world the yield-spread experiences the huge swings shown on the chart included below.

yieldcurve_270417

Last but not least, gold is influenced by the economy-wide trend in credit spreads (the differences between interest rates on high-quality and low-quality debt securities). Gold, a traditional haven in times of trouble, tends to do relatively well when credit spreads are widening and relatively poorly when credit spreads are contracting.

In summary, gold benefits from low real interest rates, an increasing yield-spread (a steepening yield curve), and widening credit spreads, each of which can occur when nominal interest rates are rising or falling.

Print This Post Print This Post

Long-term price targets are meaningless

April 24, 2017

Many commentators like to speculate on where the dollar-denominated gold price is ultimately headed. Some claim that it is destined to reach $3,000/oz, others claim that it won’t top until it hits at least $5,000/oz, and some even forecast an eventual rise to as high as $50,000/oz. All of these forecasts are meaningless.

Long-term dollar-denominated price targets are meaningless because a) they fail to account for — and cannot possibly account for, since it is unknowable — the future change in the dollar’s purchasing power, and b) the only reason a rational person invests is to preserve or increase purchasing power. To further explain by way of a hypothetical example, assume that five years from now a US dollar buys only 20% of the everyday goods and services that it buys today. In this case, the US$ gold price will have to be around $6,500/oz just to maintain its current value in purchasing power terms. To put it another way, in my example a person who buys gold at around $1300/oz today and holds it will suffer a loss, in real terms (the only terms that matter), unless the gold price is above $6,000/oz in April-2022. Considering a non-hypothetical example to make the same point, in 2007-2009 a resident of Zimbabwe who owned a small amount of gold and not much else would have become a trillionaire in Zimbabwe dollars and would also have remained poor.

The purchasing power issue is why the only long-term forecasts of gold’s value that I ever make are expressed in non-monetary terms. For example, throughout the first decade of this century I maintained that gold’s long-term bull market would continue until the Dow/gold ratio had fallen to at least 5 and would potentially continue until Dow/gold fell to 1.

The 2011 low of 5.7 in the Dow/gold ratio wasn’t far from the top of my expected bottoming range, although I doubt that the long-term downward trend is over. In any case, none of the buying/selling I do this year will be based on the realistic possibility that the Dow/gold ratio will eventually drop to 1. Such long-term forecasts are of academic interest only, or at least they should be.

If I were forced to state a very long-term target for the US$ gold price, it would be infinity. The US$ will eventually become worthless, at which point gold will have infinite value in US$ terms. But then, so will everything else that people want to own.

Print This Post Print This Post

Don’t get hung up on bull/bear labels

April 18, 2017

Gold is probably immersed in a multi-decade bull market containing cyclical bull and bear markets. We can be sure that a cyclical bear market began in 2011, but did this bear market come to an end in December of 2015? In other words, did a new cyclical gold bull get underway in December-2015? I don’t know, but the point I want to make today is that the answer to this question is not as important as most gold-market enthusiasts think.

During the first half of 2016 my view was that although a new cyclical gold bull market had probably begun, it was far from a certainty. The main reason I had some doubt was that gold’s true fundamentals* were not decisively bullish. However, by November of last year I thought it likely that a new gold bull market had NOT begun in December-2015. This was mainly because the true fundamentals had collectively become almost as gold-bearish as they ever get. It was also because it had, by then, become crystal-clear that the US equity bull market did not end in 2015.

The cyclical trend in the US stock market is important for gold. During any given year the gold price and the US stock market (as represented by the S&P500 Index) are just as likely to move in the same direction as move in opposite directions, but over long periods they are effectively at opposite ends of a seesaw. As far as I can tell, it would be unprecedented for a cyclical gold bull market to begin when a cyclical advance in the US stock market is far from complete.

In any case, for practical speculation purposes there is never a need to answer the question: bull market or bear market? In fact, there is never a need to even ask the question. The question that should always be asked is: based on all the relevant evidence at the current time, should I buy, sell or do nothing?

For example, based on the extreme negativity that prevailed at the time, the length and magnitude of the preceding price decline and a number of other considerations, it could be determined in January-2016 that an excellent opportunity to buy gold-mining stocks had arrived. Coming to this conclusion did not require having an opinion on whether a new gold bull market was getting underway. For another example, during May-August of last year an objective assessment of the price action and the important sentiment indicators revealed numerous excellent opportunities to reduce exposure to the gold-mining sector, regardless of whether or not a new bull market had begun several months earlier. For a third example, the analysis of the salient evidence in real time during December of last year suggested that another sector-wide buying opportunity had arrived in the world of gold mining. Again, taking advantage of this buying opportunity did not require an opinion on whether a cyclical gold bull market had begun back in December-2015.

The upshot is that assertions to the effect that an investment is in a bull market or a bear market can make for colourful commentary, but in the real worlds of trading and investing it’s best not to get hung up on bull and bear labels. As well as being unnecessary, fixating on such labels can be problematic. This is because someone who is convinced that a bull market is in progress will be inclined to ignore good selling opportunities and someone who is convinced that a bear market is underway will be inclined to ignore good buying opportunities.

*In no particular order, the fundamental drivers of the US$ gold price are the real US interest rate (as indicated by the 10-year TIPS yield), US credit spreads, the relative strength of the US banking sector (as indicated by the BKX/SPX ratio), the US yield curve, the general trend in commodity prices and the US dollar’s performance on the FX market (as indicated by the Dollar Index).

Print This Post Print This Post

The much-maligned paper gold market

April 5, 2017

The article “What sets the Gold Price — Is it the Paper Market or Physical Market?” contains some interesting information about the gold market and is worth reading, but it also contains some logical missteps. In this post I’ll zoom in on a couple of the logical missteps.

The following two paragraphs from near the middle of the above-linked article capture the article’s theme and will be my focus:

In essence, trading activity in the London gold market predominantly represents huge synthetic artificial gold supply, where paper gold trading is deriving the price of gold, not physical gold trading. Synthetic gold is just created out of thin air as a book-keeping entry and is executed as a cashflow transaction between the contracting parties. There is no purchase of physical gold in such a transaction, no marginal demand for gold. Synthetic paper gold therefore absorbs demand that would otherwise have flowed into the limited physical gold supply, and the gold price therefore fails to represent this demand because demand has been channelled away from physical gold transactions into synthetic gold.

Likewise, if an entity dumps gold futures contracts on the COMEX platform representing millions of ounces of gold, that entity does not need to have held any physical gold, but that transaction has an immediate effect on the international gold price. This has real world impact, because many physical gold transactions around the world take this international gold price as the basis of their transactions.

The most obvious error in the above excerpt concerns the effect of ‘dumping’ gold futures contracts on the COMEX. While this action could certainly have the immediate effect of pushing the gold price down, the short-sale of a futures contract must subsequently be closed via the purchase of a futures contract. This means that there can be no sustained reduction in the gold price due to the selling of futures contracts.

A related error is one of omission, since the gold price is often boosted by the speculative buying of futures contracts. Again, though, the effect will be temporary, since every purchase of a futures contract must be followed by a sale.

With regard to the massive non-futures paper gold market, the existence of such a market is a consequence of gold’s unique role in the commodity world. Whereas the usefulness of other commodities stems from the desire to consume them in some way, gold is widely considered to be at its most useful when it is sitting dormant in a vault. This means that to get the benefit of owning gold a person doesn’t necessarily need physical access to the gold. In many cases, a paper claim to gold sitting in a vault on the other side of the world will be considered as good as or better than having the physical gold in one’s possession. Furthermore, in many cases a piece of paper that tracks the price of gold will be considered as good as a paper claim to physical gold in a vault.

At the same time, there will be people who want ownership of physical gold — either gold in their own possession or a receipt that guarantees ownership of a specific chunk of metal stored in a vault. The gold demand of such people could not be satisfied by a piece of paper that tracked the gold price and was settled in dollars or some other currency. In other words, demand for physical gold could not be satisfied by the creation of so-called “synthetic artificial” gold.

The reality is that the existence of the massive non-futures-related “paper” gold market effectively results in a lot more gold supply AND a lot more gold demand than would otherwise be the case. To put it more succinctly, it results in a much bigger and more liquid market. This, in turn, makes it more feasible for large-scale speculators to get involved in the gold market and would not necessarily result in the gold price being lower than it would be if trading were limited to physical gold.

On a related matter, there is not a massive non-futures paper market in platinum and yet the platinum price is close to a 50-year low relative to the gold price. Also, the general level of commodity prices, as represented by the GSCI Spot Commodity Index (GNX), made an all-time low relative to gold last year. If the “paper” market is suppressing the gold price, why has gold become so expensive relative to most other commodities?

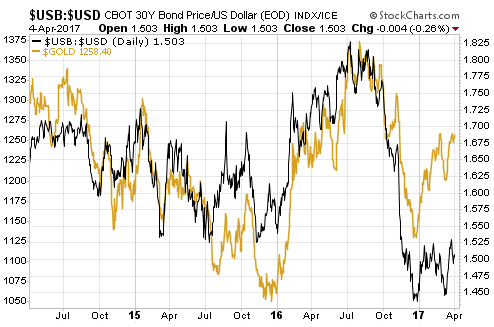
I view the whole paper-physical debate as a distraction from the true drivers of the gold price. The fact is that gold’s price movements can best be understood by reference to ‘real’ interest rates, currency exchange rates, and indicators of economic and financial-system confidence — what I refer to as gold’s true fundamentals. For example and as illustrated by the following chart, the bond/dollar ratio does a good job of explaining gold’s price trends most of the time.

gold_USBUSD_040417

In conclusion, the “paper” gold market is not a problem to be reckoned with. It is just part of the overall gold situation and, as noted above, a consequence of gold’s historical role. Moreover, it isn’t going anywhere, so it makes no sense to either complain about it or base a bullish view on its disappearance.

Print This Post Print This Post
Is gold a good store of value?

March 29, 2017

The answer to the above question is no, but it’s a trick question. Value is subjective and therefore can’t be stored, meaning that there is no such thing as a store of value. An ounce of gold, for instance, will be valued differently by different people. It will also be valued differently by the same person in different situations. For example, you might value gold highly in your present situation, but if you were stranded alone on an island with no hope of rescue then gold would probably be almost worthless to you. Rather than asking if gold is a good store of value it is more sensible to ask if gold is a good store of purchasing power in a modern economy, but this question does not have a one-word answer. It has a “yes, but…” answer.

Gold has been a good store of purchasing power in the past, but only reliably so when the initial purchase was made at a ‘reasonable’ price and the time period in question was extremely long. What I mean is that you can’t pay a ridiculously-high amount for an ounce of gold and reasonably expect the ounce to retain its purchasing power, even if the planned holding period is several decades. I also mean that if you buy gold at a time when it is being valued at a relatively moderate level you will be at risk of suffering a loss of purchasing power unless you are prepared to hold for decades.

Now, it’s not possible to come up with a single number that reflects the economy-wide change in the purchasing power of any currency, but by considering the change in the US$ gold price over time and making some basic assumptions about the change in the US dollar’s purchasing power we can get some idea of how gold’s purchasing power has shifted. Here are some examples.

First, from its September-2011 peak to its December-2015 bottom the US$ gold price fell by about 45%. There’s no way of calculating the change in the US dollar’s purchasing power over this period (the official CPI and all unofficial CPIs are bogus), but we can be certain that the US$ lost purchasing power. We can therefore be sure that gold lost more than 45% of its purchasing power over this roughly-4-year period.

Second, from its January-1980 peak to its February-2001 bottom the US$ gold price fell by about 70%. Again, there’s no way of calculating the change in the US dollar’s purchasing power over this period, but we can be certain that the US dollar’s purchasing power was much lower in February-2001 than it was in January-1980. We can therefore identify a 21-year period during which gold lost substantially more than 70% of its purchasing power.

Third, anyone who bought gold near the January-1980 top (37 years ago) and held to the present day would still not be close to breaking even in purchasing-power terms, even though the nominal price is now about 50% higher. Moreover, it’s conceivable that buyers of gold near the top in January-1980 will never break even in purchasing-power terms, regardless of how long they hold.

Fourth, by making the same type of rough-but-realistic assumptions about changes in the US dollar’s purchasing power it can be established that there were two periods of 8-10 years over the past 5 decades when there were huge increases in gold’s purchasing power.

The point is that when gold is not money (the general medium of exchange) it tends NOT to maintain its purchasing power over what most people would consider to be a normal investment timeframe. Instead, gold’s purchasing power tends to experience massive swings. By being knowledgeable and unemotional you can take advantage of these swings. What you can’t reasonably expect to do is conserve your purchasing power by mindlessly buying gold at any price.

Print This Post Print This Post