The scale of the gold market

May 9, 2016

This post is a modified excerpt from a recent TSI commentary.

The amount of gold flowing into and out of the SPDR Gold Trust (GLD) inventory is often portrayed as an important driver of the gold price, but it is nothing of the sort. As I’ve previously explained*, due to the way the ETF operates it can reasonably be viewed as an effect, but not a cause, of a change in the gold price. In any case, the amount of gold that shifts into and out of the GLD inventory is trivial in comparison to the overall market.

Since the beginning of December last year the average daily change in GLD’s physical gold inventory has been about 3 tonnes, or about 0.1M ounces. To most of us, 0.1M ounces of gold would represent huge monetary value (at US$1250/oz, 0.1M ounces is worth US$125M), but within the context of the global gold market it is a very small amount.

To give you an idea of how small I point out that over the same period (since the beginning of December last year) the average amount of gold traded per day via the LBMA (London Bullion Market Association) was around 20M ounces. Also over the same period, average daily trading volume on the COMEX was roughly 250K gold futures contracts. A futures contract covers 100 ounces, so the average daily trading volume on the COMEX was equivalent to about 25M ounces.

Very roughly, then, the combined average amount of gold traded per day via the facilities of the LBMA and the COMEX over the past few months was 45M ounces. This amount is 450-times greater than the average daily change in the GLD inventory and still covers only part of the overall market.

As an aside, over the past few months the average daily trading volume in GLD shares has been about 15M. A GLD share represents slightly less than 0.1 ounces of gold, so this equates to about 1.5M gold ounces. The volume of trading in GLD shares is therefore an order of magnitude more significant than the volume of physical gold going into and out of the GLD inventory, but it is still a long way from being the most influential part of the overall market.

Once you understand the scale of the overall gold market you will realise that many of the gold-related figures that are carefully tracked and often portrayed as important are, in reality, far too small to have a significant effect on price. For example, the quantity of gold that trades via the combined facilities of the LBMA and the COMEX on an average DAY is about 45-times greater than the quantity of gold sold in coin form by the US Mint in an average YEAR.

An obvious objection to the above is that I am conflating physical gold and “paper gold” (paper claims to current gold or future gold). Yes, I am doing exactly that. When considering price formation in the gold market it makes sense to consider the ‘physical’ and ‘paper’ components together because they are tightly linked by arbitrage-related trading. In particular, in the major gold-trading centres the price of a 400-oz good-delivery bar of physical gold is always closely related to the prices of futures contracts and the prices of other well-established paper claims to gold.

So, don’t be misled by analyses that focus on relatively minor shifts in physical gold location. Just because something can be counted (for example, the daily change in the GLD gold inventory) doesn’t mean it is worth counting, and just because something can’t be counted (for example, the total amounts of gold traded and hoarded by people throughout the world) doesn’t mean it isn’t important.

*My last two blog posts on the topic are HERE and HERE. The crux of the matter is that neither a rising gold price nor a rising GLD share price necessarily results in the addition of gold to GLD’s inventory. Additions of gold only happen if GLD’s share price rises relative to its net asset value and deletions of gold only happen when GLD’s share price falls relative to its net asset value, with the process driven by the arbitrage-trading of Authorised Participants.

Print This Post Print This Post

The relentless COMEX fear-mongering

May 6, 2016

321gold.com’s Bob Moriarty recently took someone to task for making the wrongheaded assertion that there was a high risk of the CME (usually still called the COMEX) defaulting due to the amount of paper claims to gold being orders of magnitude greater than the amount of physical gold in store. Bob makes the correct point that a default isn’t possible because the COMEX allows for cash settlement if necessary. However, the assertions being made by the default fear-mongers aren’t just wrong due to a failure to take into account the cash settlement provision; they would be complete nonsense even if there were no cash settlement provision. I’ve briefly explained why in previous blog posts (for example, HERE). In this post I’ll supply a little more detail.

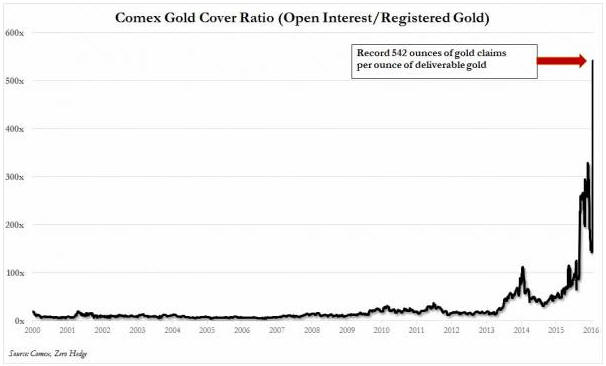
I suspect that when it comes to the idea that a COMEX default is looming, ZeroHedge.com is “fear-monger zero*”. Every now and then ZeroHedge posts a chart showing the total Open Interest (OI) in COMEX gold futures divided by the amount of “Registered” gold in COMEX warehouses. An example is the chart displayed below, which was taken from the article posted HERE. The result of this division is supposedly the amount of gold that could potentially be demanded for delivery versus the amount of gold available for delivery, with extremely high numbers for the ratio supposedly indicating that there is a high risk of a COMEX default due to insufficient physical gold in storage. I say “supposedly”, because it actually indicates no such thing. The ratio routinely displayed by ZeroHedge — and other gold market ‘pundits’ who spout the same baloney — is actually meaningless.

ZH_goldcover_050516

One reason it is meaningless is that the amount of gold available for delivery is the amount of “Registered” gold PLUS the amount of “Eligible” gold, meaning the TOTAL amount of gold at the COMEX. It is true that only Registered gold can be delivered against a contract, but it is a quick and simple process to convert between Eligible and Registered. In fact, much of the gold that ends up getting delivered into contracts comes from the Eligible stockpile, with the conversion from Eligible to Registered happening just prior to delivery.

Taking a look at the ratio of COMEX Open Interest to total COMEX gold inventory via the following chart prepared by Nick Laird (www.sharelynx.com), we see that it has oscillated within a 3.5-6.5 range over the past 7 years and that nothing out of the ordinary happened over the past three years.

COMEXOI_TOTINV_050516

Another reason that the OI/Registered ratio regularly displayed by ZeroHedge et al is meaningless is that the total Open Interest in gold futures is NOT the amount of gold that could potentially be demanded for delivery. The amount of gold that could potentially be demanded for delivery is the amount of open interest in the nearest contract. For example, when ZeroHedge posted its dramatic “Something Snapped At The Comex” article in late-January to supposedly make the point that there were more than 500 ounces of gold that could potentially be called for delivery for every available ounce of physical gold, in reality there were about 15 ounces of physical gold in COMEX warehouses for every ounce that could actually have been called for delivery into the expiring (February-2016) contract.

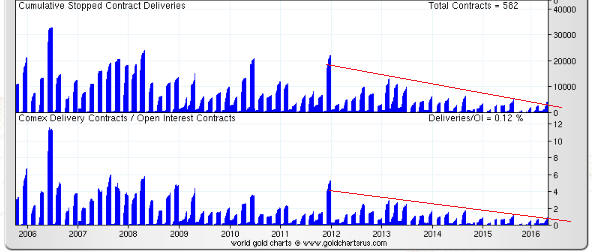
Although it provides no information about the ability of short sellers to deliver against expiring futures contracts when called to do so, it is reasonable to ask why the ratio of total OI to Registered gold rose to such a high level. I can only guess, but I suspect that the following chart (also from www.sharelynx.com) contains the explanation.

The chart shows the cumulative stopped contract deliveries, or the amount of gold that was delivered into each expiring contract, in absolute terms and relative to open interest. Notice the downward trend beginning in late-2011. Notice also that the amount of gold delivered to futures ‘longs’ over the past two years is much less in both absolute and relative terms than at any other time over the past decade.

It is clear that as the gold price fell, the desire of futures traders to ‘stop’ a contract and take delivery of physical gold also fell. In other words, the unusually-small amount of gold maintained in the Registered category over the past two years reflects the unusually-low desire on the part of futures ‘longs’ to take delivery.

It’s a good bet that if a multi-year gold rally began last December (I think it did) then the desire to take delivery will increase over the next couple of years, prompting a larger amount of gold to be held in the Registered category.

COMEXDELIV_050516

In conclusion, the fact is that at no time over the past several years has there been even a small risk of either a COMEX default or the COMEX falling back on its cash settlement provision. However, this fact is obviously not as exciting as the fiction that is regularly published by scare-mongers in their efforts to attract readers and separate the gullible from their money.

*The equivalent of Patient Zero in an epidemiological investigation.

Print This Post Print This Post

A critical juncture for gold

May 4, 2016

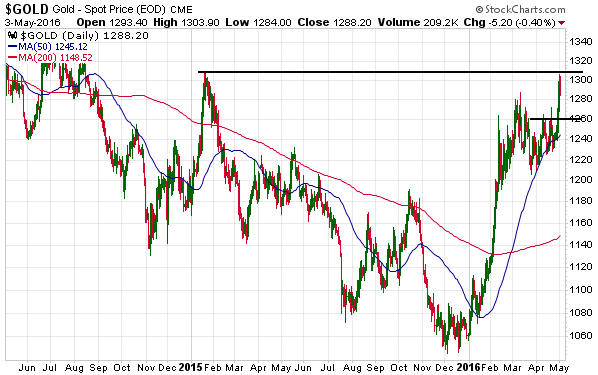
The US$ gold price is testing important resistance defined by last year’s high, which opens up the possibility that a useful price signal will soon be generated. There are two ways that this could happen.

One way is for the price to achieve a weekly close above last year’s high of $1308. This wouldn’t necessarily point to immediate additional upside, but it would suggest that the overall advance from last December’s low was set to continue for another 1-2 months. The other is for the price to trade above last year’s high of $1308 during the week but fail to achieve a weekly close above this level. This would warn that the overall advance from last December’s low was over (meaning: a multi-month correction was probably getting started).

Note that not all price action contains clues about the future. For example, during the first two days of this week the US$ gold price consolidated below last year’s high, which doesn’t tell us anything useful.

gold_blog_030516

Gold’s true fundamentals* turned bullish early this year but are currently about as neutral as they get, with half of them bullish and the other half bearish. Moreover, of the two fundamental drivers that exerted the greatest influence over the past 12 months, one (the relative strength of the banking sector) recently turned bearish while the other (the real interest rate) is still bullish. This suggests that an additional large short-term rise in the gold price will depend on increased speculation in the futures market. Interestingly, Keith Weiner comes to a similar conclusion from a very different assessment of gold fundamentals.

*The gold market’s six most important fundamental drivers are the real interest rate, the yield curve, credit spreads, the relative strength of the banking sector, the US dollar’s exchange rate and the general trend for commodity prices.

Print This Post Print This Post
Making stuff up

April 30, 2016

This will be the shortest TSI blog post to date. I just wanted to point out that newsletter writers, bloggers and other posters on the internet who claim knowledge of what was discussed in secret conversations between high-level policy-makers are just making up stories. If you take this BS at face value, more the fool you.

Print This Post Print This Post