Gold has peaked for the year

June 27, 2016

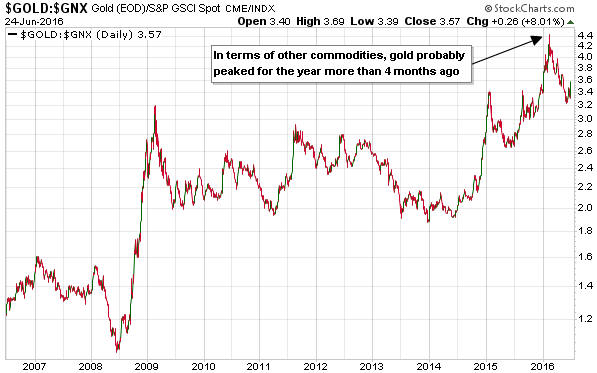
Gold has probably peaked for the year. Not necessarily in US$ terms, but in terms of other commodities.

In fact, relative to the Goldman Sachs Spot Commodity Index (GNX) the peak for this year most likely happened back in February. The February-2016 peak for the gold/GNX ratio wasn’t just any old high, it was an all-time high. In other words, at that time gold was more expensive than it had ever been relative to commodities in general.

Also worth mentioning is that when the US$ gold price spiked up to its highest level in more than 18 months as part of the “Brexit” mini-panic late last week, the rise in GNX terms was much less impressive. As illustrated below, last Friday’s move in the gold/GNX ratio looks more like a counter-trend bounce than an extension of the longer-term upward trend.

gold_GNX_270616

The February-2016 extreme in the gold/GNX ratio had more to do with the cheapness of other commodities than the expensiveness of gold, and the subsequent relative weakness in the gold price was mostly about other commodities making catch-up moves. This is actually the way things normally go at cyclical bottoms for commodities. The historical sample size is admittedly small, but it’s typical for gold to turn upward ahead of the commodity indices and to be a relative strength leader in the initial stage of a cyclical bull market. Gold then relinquishes its leadership.

Perhaps it will turn out to be different this time, but over the past 8 months the story has unfolded the way it should based on history and logic. An implication is that if the US$ gold price made a major bottom last December then the general commodity indices aren’t going to get any cheaper in US$ terms or gold terms than they were in January-February of this year.

Around cyclical lows, gold leads and the rest of the commodity world follows.

Print This Post Print This Post

The evidence be damned!

June 23, 2016

I was blown away by the following two charts from Jeffrey Snider’s article titled “The European Basis For New Monetary Science“.

As most of you probably know, the Mario Draghi-led ECB embarked on a ‘suped-up’ QE program in March of 2015. The idea behind this program was that by monetising 60B euros of bonds per month the ECB would promote faster credit expansion throughout Europe. The two charts from the aforelinked Snider article show the results to April-2016.

The first chart shows that as at April-2016, 727 billion euros of ECB asset monetisation had been accompanied by an increase in total lending of only 71 billion euros. As neatly summarised by Snider, this means that there was less than one euro in additional lending for every ten in ECB foolishness.

The second chart shows loans to European non-financial corporations, which actually contracted slightly during the first 13 months of the ECB’s suped-up credit-expansion program.

EZlending_total_220616

EZlending_NFC_220616

The QE program was therefore a total failure even by the jaundiced standards of the central-banking world, that is, it failed even ignoring the reality that faster credit expansion cannot possibly be good for an economy labouring under the weight of excessive debt. The weirdest thing is, the obvious failure is not viewed by Draghi as evidence that QE doesn’t do what it is supposed to do. Instead, it is viewed as evidence that more of the same is needed. Hence the increase in the pace of asset monetisation from 60B to 80B euros per month announced in March-2016 and implemented this month.

I shudder to think how Draghi’s monetary experiment will end.

Print This Post Print This Post

Central bankers believe that they can provide free lunches

June 20, 2016

[This post is a modified excerpt from a recent TSI commentary.]

A lot of good economic theory boils down to the acronym TANSTAAFL, which stands for “There Ain’t No Such Thing As A Free Lunch”. TANSTAAFL is an unavoidable law of economics, because everything must be paid for one way or another. Furthermore, attempts by policymakers to get around this law invariably result in a higher overall cost to the economy. Unfortunately, central bankers either don’t know about TANSTAAFL or are naive enough to believe that their manipulations can provide something for nothing. They seem to believe that the appropriate acronym is CBCCFLAW, which stands for “Central Banks Can Create Free Lunches At Will”.

ECB chief Mario Draghi is the leader in applying policies based on CBCCFLAW. Despite his economic stimulation measures having a record to date that is unblemished by success, he recently launched new attempts to conjure-up a free lunch.

I’m referring to two measures that were announced in March and have just started to be implemented, the first of which is the ECB’s corporate bond-buying program (starting this month the ECB will be monetising investment-grade corporate bonds in addition to government bonds). This program is designed to bring about a further reduction in interest rates, because, as we all know, if there’s one thing that’s holding Europe back it’s excessively high interest rates, where “excessively high” means above zero.

Unlike the situation in the US, very little corporate borrowing in Europe is done via the bond market. The ECB’s new corporate bond-buying program is therefore unlikely to provide even a short-term boost, but, not to worry, that’s where the ECB’s second measure comes into play.

The ECB’s second measure is a new round of a previously-tried program called the Targeted Long Term Refinancing Operation (TLTRO). Under the TLTRO program, commercial banks get encouraged — via a near-zero or negative interest rate — to borrow money from the ECB on the condition that the banks use the money to make new loans to the private sector.

The combination of the ECB’s two new measures is supposed to promote credit expansion and higher “inflation”. In other words, to the extent that the measures are successful they will result in more debt and a higher cost of living. In Draghi’s mind, this would be a positive outcome.

In the bizarre world occupied by the likes of Draghi, Yellen and Kuroda, the failure of an economy to strengthen in response to a policy designed to stimulate growth never, ever, means that the policy was wrong. It always means that not enough was done. It’s not so much that these central planners refuse to see the flaws in their policies, it’s that they cannot possibly see. They cannot possibly see because they are looking at the world through a Keynesian lens. Trying to understand how the economy works using Keynesian theory is like trying to understand the movements of the planets using the theory that everything revolves around the Earth.

So, the worse things get in response to counter-productive ‘economic stimulation’ policies, the more aggressively the same sorts of policies will be applied and the worse things will eventually get. This is what I’ve referred to as the Keynesian death spiral.

Print This Post Print This Post

Reversals

June 17, 2016

The price action in many financial markets was nothing if not interesting on Thursday 16th June. Of particular interest, there were several price reversals that could be significant (for TSI subscribers, the significance will be discussed in this weekend’s commentary).

One reversal of potential consequence happened in the gold market, with the gold price moving well above its early-May high and last year’s high ($1308) before turning around and ending the day with a loss.

gold_160616

Another reversal happened in the silver market. Silver’s reversal looks more important than gold’s because it resulted in an “outside down day” and created a bearish divergence between the gold and silver markets (a new high for gold combined with a lower high for silver).

silver_160616

Not surprisingly, the downward reversal in gold coincided with an upward reversal in the US stock market. For example, the Dow Transportation Average, which has led the more-senior US stock indices over the past 18 months, broke below short-term support early on Thursday and then recovered to end the day above support.

TRAN_160616

In the currency market there were actually two reversals, with the Dollar Index first reversing upward after trading well below the preceding day’s low and then reversing downward after trading well above the preceding day’s high to end the day roughly unchanged.

US$_160616

The financial markets are obviously being buffeted by Brexit-related news and are likely to remain more news-dependent than usual for another 1-2 weeks.

Print This Post Print This Post