Interesting aspects of the current financial situation

November 1, 2016

Here are a few aspects of the current financial situation that I find interesting:

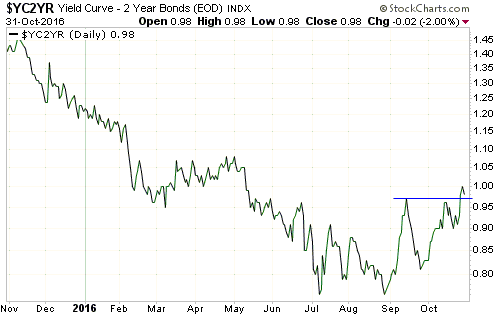
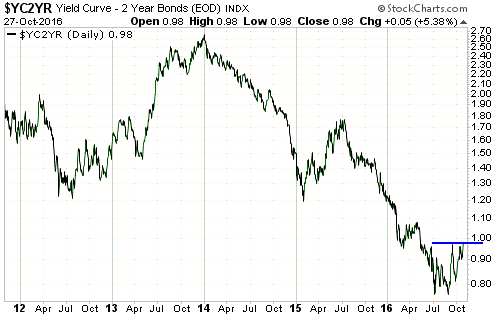
1) The spread between the 10-year T-Note yield and the 2-year T-Note yield is a proxy for the US yield curve. When this yield-spread is widening it implies that the yield curve is steepening and when this yield-spread is narrowing it implies that the yield curve is flattening.

The following chart shows that the 10yr-2yr yield-spread broke above its September high late last week. This is evidence that the US yield curve has shifted from a flattening to a steepening trend, which is a recession warning and a bearish omen for the US stock market. It is also bullish for gold, although the overall fundamental backdrop is no better than neutral for gold.

yieldcurve_311016

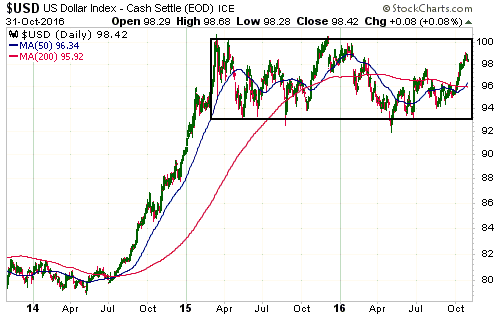
2) As illustrated below, the Dollar Index has been oscillating within a horizontal range for about 20 months. It has worked its way upwards since May of this year, but is roughly unchanged since the beginning of the year and is about 2 points below the top of its 20-month range.

The fact that the Dollar Index is roughly unchanged since the start of this year is interesting because the dominant fundamental driver of intermediate-term trends in the US dollar’s exchange rate (the relative strength of the US stock market) has been US$-bullish throughout this year. By rights, the Dollar Index should be well above its current level.

There are two reasons that the Dollar Index is still trapped within its horizontal range. One is that there was a huge sentiment-driven overshoot to the upside during the first quarter of 2015. The other is mentioned below.

US$_311016

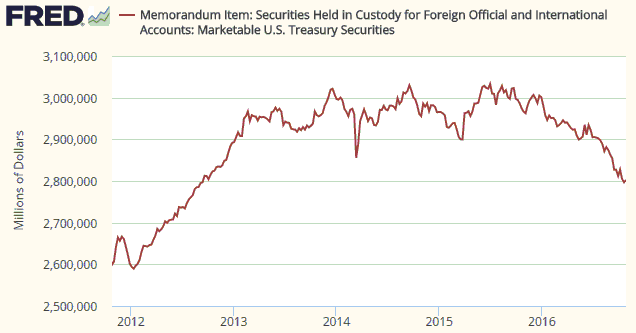
3) The following chart shows the Treasury securities held in custody at the Fed for foreign central banks (FCBs). Not all US government debt securities owned by FCBs are held at the Fed, but more than half of them are and trends in the Fed’s custody holdings should reflect trends in overall holdings.

The chart shows that FCBs stopped being net buyers of US government debt in December-2013 and have been relentless net-sellers since December of last year. This tells us that FCBs have made a concerted attempt over the past 10 months to weaken the US$. This, I suspect, is a reason that the Dollar Index has remained range-bound this year to date despite the upward pressure exerted by US$-bullish fundamentals.

FCBTreasuries_311016

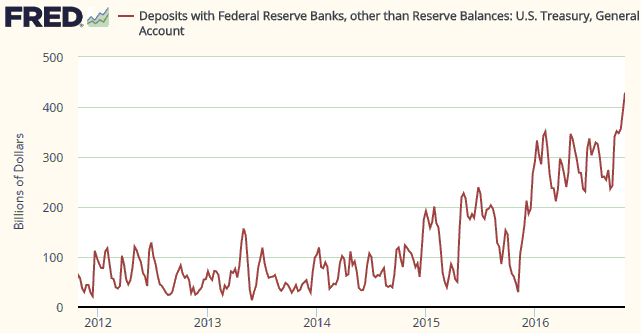
4) The following chart shows the amount of money held in the US federal government’s account at the Fed. Prior to the past year or so the amount of money in the Treasury’s deposit at the Fed was usually below $100B and had never been more than $200B, but something changed in November of 2015.

Since early-November of 2015 there has been a net addition of about $400B to the Treasury’s account at the Fed. This means that the Treasury has temporarily withdrawn about $400B from the US economy over the past 12 months, an action that is, in effect, a monetary tightening. This action would undoubtedly have slowed the pace of US economic activity.

The Treasury is obviously not trying to reduce the pace of economic activity. Why would it, especially in the lead-up to an election? It is, instead, trying to build-up a larger cash buffer for risk management purposes, possibly in expectation of more inter-party haggling over the debt ceiling.

TreasuryGeneral_311016

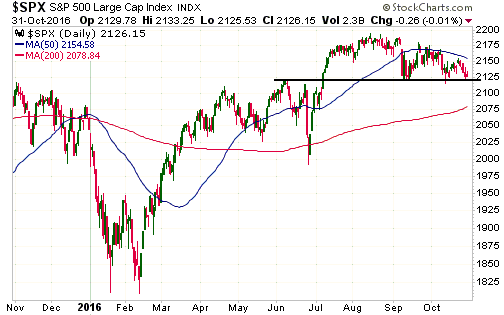
5) The final chart shows that the S&P500 Index is precariously poised near a technical precipice. A downside breakout will probably soon happen, but until support at 2120 is decisively breached there will be an outside chance of a rise to new highs prior to a tradable decline.

SPX_311016

Print This Post Print This Post

Chanting “it’s a bull market” won’t make it so

October 28, 2016

I’ve seen a lot of commentary in which the author assumes that this year’s rally in the gold price is the first rally in a new cyclical bull market. It probably is, but at this stage — as the saying goes — the jury is still out. At this stage it’s best to reserve judgment, because blindly assuming something that might not be true can lead to large losses.

There are two main reasons that ‘the jury is still out’. First and foremost, at no time over the past 12 months have gold’s true fundamentals* been definitively bullish. Instead, they have oscillated around neutral. There have been periods, such as February-April of this year, during which the fundamentals had a bullish skew, but after tipping in the bullish direction for at most 3 months they have always tipped in the other direction for a while.

Considering what central banks have been doing to the official forms of money my statement that the fundamental backdrop is not definitively gold-bullish could seem strange. After all, the ECB is firmly committed to asset monetisation and negative interest rates based on the belief that these counter-productive policies are working, and the Federal Reserve is seemingly afraid to take even a small step towards “policy normalisation” despite its targets for employment and “inflation” having been reached more than three years ago. However, gold’s fundamentals are determined by confidence, not by sound principles of economics. To put it another way, whether the fundamental backdrop is bullish or bearish for gold is determined by the general perception of what’s happening on the economic and monetary fronts rather than what’s actually happening. Perception will eventually move into line with reality, but in the meantime years can go by.

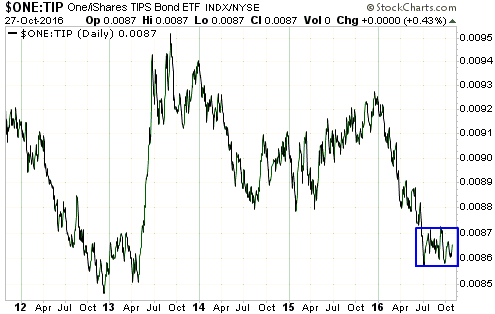
Since early-July the true fundamentals have been neutral at best and over the past month they have, on balance, been slightly bearish. However, they are constantly in flux and it currently wouldn’t take much to shift them to bullish or make them definitively bearish. In particular, two of the most important fundamental drivers of the gold price are neutral and positioned in a way that they could soon shift decisively in one direction or the other. I’m referring to the real interest rate, as indicated on the first of the following charts by the reciprocal of the TIPS bond ETF (1/TIP), and the US yield curve, as indicated on the second of the following charts by the 10yr-2yr yield spread.

The real interest rate would turn decisively gold-bullish if 1/TIP were to break downward from its recent 4-month range and decisively gold-bearish if 1/TIP were to break upward from its recent 4-month range. The yield curve, which has been gold-bearish for the bulk of the past three years, would turn decisively gold-bullish if the 10yr-2yr yield spread were to break solidly above its September high. Note that it is very close to doing exactly that. As an aside, a break by the 10yr-2yr yield spread above its September high would also be a recession warning and a bearish omen for the stock market.

Realint_271016

yieldcurve_271016

The price action is the other reason for the uncertainty as to whether this year’s rally marked the start of a cyclical bull market. I’m referring to the fact that of all the rallies in gold and the gold-mining indices from multi-year lows, this year’s rally is most similar to the bear-market rebound of 1982-1983.

The gold rally that began in December of 2015 will differentiate itself from the 1982-1983 bear-market rebound if the gold price closes above its July-2016 peak AND the HUI closes above its August-2016 peak.

Fortunately, you don’t need to be a fervent believer in the ‘new gold bull market’ story to make money from the rallies in gold and gold stocks. You will just tend to be more cautious than the bulls with blind faith.

*Five of the six “true fundamentals” were mentioned in the September-2015 TSI blog post linked HERE. The sixth is the general trend in commodity prices as indicated by a broad-based commodity index such as GNX.

Print This Post Print This Post
“Price inflation” is not the biggest problem

October 18, 2016

All else remaining equal, an increase in the supply of money will lead to a decrease in the purchasing-power (price) of money. Furthermore, this is the only effect of monetary inflation that the average economist or central banker cares about. Increases in the money supply are therefore generally considered to be harmless or even beneficial as long as the purchasing-power of money is perceived to be fairly stable*. However, reduced purchasing-power for money is not the most important adverse effect of monetary inflation.

If an increase in the supply of money led to a proportional shift in prices throughout the economy then its consequences would be both easy to see and not particularly troublesome. Unfortunately, that’s not the way it happens. What actually happens is that monetary inflation causes changes in relative prices, with the spending of the first recipients of the newly-created money determining the prices that rise the first and the most.

Changes in relative prices generate signals that direct investment. The further these signals are from reality, that is, the more these signals are distorted by the creation of new money, the more investing errors there will be and the less productive the economy will become.

Also, although adding to the money supply cannot possibly increase the economy-wide level of savings, monetary inflation temporarily creates the impression that there are more savings than is actually the case. This reduces interest rates, which prompts investments in ventures that are predicated on unrealistic forecasts of future consumer spending. Again, the eventual result will be a less productive economy.

During any given year it usually won’t be possible to separate-out the pernicious effects of monetary inflation and the distortion of interest rates that goes hand-in-hand with it from all the other forces affecting the economy. There will simply be too many things going on in the world that could be influencing the data. However, by taking a wide-angle (that is, long term) view it will often be possible to see the effects on the economy of shifts in monetary inflation.

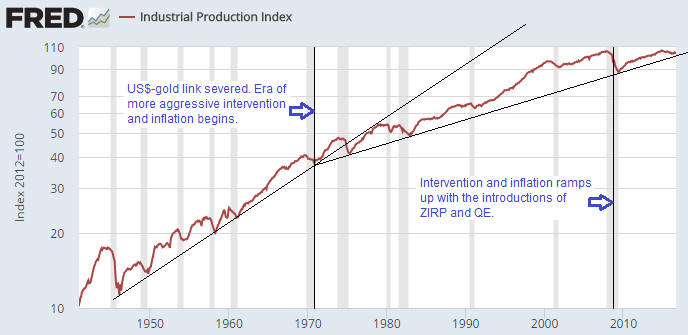
As an example of how long-term shifts in monetary inflation/intervention can be linked to long-term shifts in economic progress I present the following chart of the US Industrial Production Index. The chart shows that the industrial-production growth trend flattened at around the time that the ‘golden shackles’ were removed, that is, at around the time that the Fed was essentially empowered to do a lot more. This is not a fluke. The chart also shows that the ramping-up of the Fed’s monetary interventions in 2008-2009 has been followed by the weakest post-recession recovery in at least 70 years. Again, this is not a fluke.

IndustProd_181016

In economics, to have a chance of correctly interpreting cause and effect in the data you first have to know the right theory. That’s why Keynesian economists will not link the US industrial production slowdown with the Fed’s increasingly aggressive monetary interventions. From their perspective, the only negative effect that monetary inflation can possibly have is to make the cost of living rise at a faster pace than they believe it should be rising.

*Stable, here, means rising at around 2% per year. Note that it is not possible to come up with a single number that represents the economy-wide purchasing power of money, but this doesn’t stop the government (and some private organisations and individuals) from doing exactly that.

Print This Post Print This Post
The gold manipulation silliness continues

October 14, 2016

Not surprisingly, one of the silliest explanations for last week’s sharp decline in the gold price appeared in an article posted at the Zero Hedge web site. According to this article, the only plausible explanation for the decline is rampant manipulation while China’s markets were closed for the “Golden Week” public holidays*.

In an effort to prove that manipulators in the West routinely take advantage of China’s markets being closed to suppress the gold price, the article includes charts covering the 2015 and 2014 “Golden Week” holiday periods. These charts suggest that, as was the case this year, the gold price tanked during each of the preceding two years when China was closed for business. However, the charts are very misleading. Deliberately so, in my opinion.

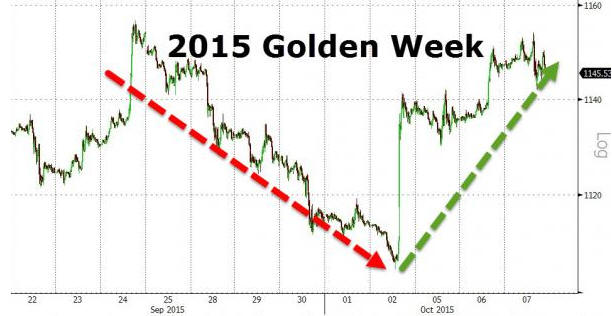
For example, the following chart from the article suggests that the gold price plunged from the $1140s to around $1105 during the 2015 “Golden Week” holidays and then quickly recouped its losses after China’s markets re-opened, but that’s not the case. The “Golden Week” is from 1st to 7th October every year, so what actually happened was that the gold price fell from the $1140′s down to around $1115 during the days leading up to the 2015 “Golden Week” (while China was open for business) and then rebounded to the $1140s while China was on holiday.

gold_2015_141016

During the 2014 “Golden Week” holiday period there was no net change in the gold price.

The belief that manipulation is the be-all-and-end-all of the gold market is based on two false premises. The first is that the fundamentals are always gold-bullish. The second is that when financial markets are free from manipulation they always move in concert with the fundamentals. If you hold these two totally-wrong beliefs then every time there is a significant decline in the gold price you will naturally conclude that manipulation was the cause.

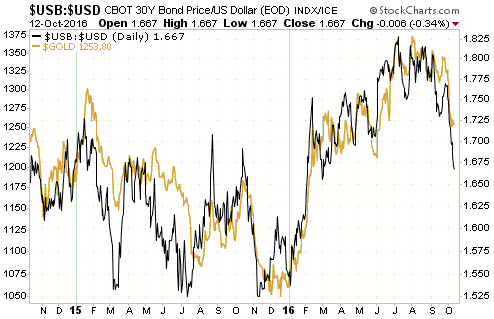
The reality is that gold’s true fundamentals have been deteriorating since July and that the pace of deterioration picked up over the past three weeks. At the same time, speculators in gold futures were adding to the risk of a steep downward price adjustment by stubbornly maintaining an extremely high net-long position.

The following chart compares the gold price with the bond/dollar ratio. The fundamental deterioration and the delayed response of the gold market can clearly be seen on this chart.

Gold market participants and observers who were looking at the right indicators will not have been surprised by last week’s price decline.

*China is apparently the bastion of honest price discovery in the gold market and corrupt Western bankers apparently wait for the Chinese to go on vacation before launching their bear raids.

Print This Post Print This Post