More confusion about gold demand

Print This Post Print This Post

More confusion about gold demand

“Nonsensical Gold Commentary” was the title of a recent Mineweb article in which the author, Lawrence Williams, laments that a significant amount of commentary published on gold can be uninformed and misleading. This is ironic, since the bulk of Lawrence Williams’ writings about the gold market (and the silver market) are uninformed and misleading.

When it comes to his gold-market commentary, Mr. William’s most frequent mistake is to focus on the amount of gold ‘flowing’ into China as if this were one of the most important drivers, if not the most important driver, of the gold price. To be fair, in this regard he has a lot of company and much of what he writes on the topic is copied from the wrongheaded analyses put forward by reputed experts on gold.

I’ve dealt with the China gold fallacy in several previous posts*. It is related to the more general fallacy that useful information about gold demand and the gold price can be obtained by monitoring the amount of gold being transferred from one part of the market to another or from one geographical region to another.

Since every gold transaction involves an increase in gold demand on the part of the buyer and an exactly offsetting decrease in gold demand on the part of the seller, it should be obvious that overall demand cannot possibly change as a result of any purchase/sale. And it should be obvious that regardless of whether gold’s price is in a bullish or a bearish trend, some parts of the market and some geographical regions will be net buyers and others will be net sellers. And it should also be obvious that an increase in volume — which requires an increase in both buying and selling — can accompany a price decline or a price advance, meaning that there is nothing strange about a fall in price going hand-in-hand with increased buying or a rise in price going hand-in-hand with increased selling.

Unfortunately, none of these facts are apparent to the gold analysts who attempt to obtain clues about gold’s price performance and prospects by tracking the amount of gold being transferred from sellers to buyers.

I’m reticent to pick on Lawrence Williams, because I suspect that he means well and, as mentioned above, he has a lot of company. However, his commentary is difficult for me to ignore, the reason being that I closely monitor the Mineweb site and therefore can’t avoid seeing the headlines of the articles he writes. For example, when scanning through the Mineweb headlines a few days ago I was enticed to click on an article titled “SGE gold withdrawals surge again“, which turned out to be another Williams piece about China’s gold demand. Although this article regurgitated some of the usual misleading information, the last paragraph was interesting.

The last paragraph was interesting because it contained a blatant contradiction. Here’s the relevant excerpt:

…the overall level of SGE [Shanghai Gold Exchange] withdrawals has to be a consistent indicator of Chinese demand trends and from them it looks as though the trend is rising so far this year whether they are a definitive measure of Chinese wholesale gold consumption or not. They are most certainly a measure of China’s internal gold flows.

The last sentence is correct. The SGE withdrawals are a measure of internal gold flows, that is, a measure of the amount of gold transferred from some people in China to other people in China. As a consequence, they provide NO information about overall Chinese demand trends. The last sentence therefore contradicts the preceding sentence and shines a light on the confusion in the minds of those who attempt to gather useful information about the gold price by fixating on trading volumes.

*For example: HERE, HERE, HERE and HERE.

Print This Post Print This Post

The gold supply-demand nonsense is relentless

In a blog post a couple of weeks ago I noted that it’s normal for large and fast price declines in the major financial markets to be accompanied by unusually-high trading volumes, meaning that it’s normal for large and fast price declines in the major financial markets to be accompanied by increased BUYING. I then wondered aloud as to why it is held up as evidence that something nefarious or strange is happening whenever an increase in gold buying accompanies a sharp decline in the gold price. Right on cue, ZeroHedge.com (ZH) has just published an article marveling — as if it were an inexplicable development — at how the recent sharp decline in the gold price was accompanied by an increase in buying.

As is often the case in the realm of gold-market analysis, the ZH article incorrectly conflates volume and demand. The demand for physical gold must always equal the supply of physical gold, with the price rising or falling by the amount needed to maintain the balance. If sellers are more motivated than buyers, then price will have to fall to restore the balance. The key point to understand here is that for every buyer there must be seller, and vice versa, so the purchase/sale of gold does not indicate a change in overall demand — it only indicates a fall in demand on the part of the seller and an exactly offsetting increase in demand on the part of the buyer. It is also worth noting — even though it should be obvious — that demand for physical gold cannot be satisfied by paper gold.

Trading in paper gold (gold futures, to be specific) clearly does have an effect on the price at which physical gold changes hands. The paper and physical markets are inextricably linked, but this link does not make it possible for the demand for physical gold to rise relative to the supply of physical gold in parallel with a falling price for physical gold.

What happens in the real world is that when the futures market leads the physical market higher or lower it changes the spread between the spot price and the price for future delivery. For example, when the gold price is being driven downward by speculative selling in the futures market, the price of gold for future delivery will fall relative to the spot price. In a period when risk-free short-term interest rates are being pegged at or near zero by central banks, this can result in the spot price becoming higher than the price of gold for delivery in a few months’ time. This creates a financial incentive for other operators in the gold market to buy gold futures and sell physical gold. For another example, when the gold price is being driven upward by speculative buying in the futures market, the price of gold for future delivery will rise relative to the spot price. This creates a financial incentive for other operators in the gold market to sell gold futures and buy physical gold.

The bullion banks are the “other operators”. They tend to focus on trading the spreads between the physical and futures markets. In doing so they position themselves to make a small percentage profit regardless of the price trend and therefore tend to be agnostic with regard to the price trend.

After harping on about the dislocation between the physical and paper gold markets, a dislocation that doesn’t actually exist but makes for good copy in some quarters, the above-mentioned ZH article moves on to the level of the CME (often still referred to as the COMEX) gold inventory. To the sound of an imaginary drumroll, the author of the article breathlessly points out that the amount of “registered” gold at the COMEX has dropped to a 10-year low and that the amount of “open interest” in gold futures is now at a 10-year high relative to the amount of “registered” gold.

The information is correct, but isn’t relevant other than as a sentiment indicator. It’s a reflection of what has happened to the price over the past few weeks and the increase in negativity that occurred in reaction to this price move. It is not evidence of physical-gold scarcity.

I currently don’t have the time to get into any more detail on the COMEX inventory situation. However, if you are interested in delving a little deeper you could start by reading the July-2013 article posted HERE. I get the impression that this article was written in response to the scare-mongering that ZH was doing on the same issue two years ago.

Thanks largely to the unprecedented measures taken by the senior central banks over the past few years, there have been many strange happenings in the financial world. However, the increased buying of physical gold in parallel with a sharply declining gold price and the reduction in COMEX “registered” gold cannot be counted among them.

Print This Post Print This Post

Yet another useless article about gold supply and demand

A recent article at Mineweb discusses the latest gold-market analysis of Gold Fields Mineral Services (GFMS). As far as past or likely future gold price movements are concerned, every sentence in this article is either completely wrong or completely irrelevant.

The GFMS analysis discussed in the article follows the typical, wrongheaded pattern of adding up the flows between different parts of the market and using these flows to estimate supply and demand. It’s the same mistake I’ve addressed many times in the past, most recently in a 26th January blog post. The mistake is largely based on the misconception that current mine production constitutes the supply side of the equation, rather than just a small increment to an existing aboveground inventory.

If you start with a totally wrong premise, you will probably end up with a ludicrous conclusion. In this case the ludicrous conclusion is that gold supply is currently greater than gold demand.

In a market that clears (such as the gold market), supply can never be greater than demand and demand can never be greater than supply. Supply and demand must always be equal, with the price constantly changing to whatever it needs to be to maintain the balance.

Claiming that the supply of gold exceeds the demand for gold would be like claiming that the supply of dollars exceeded the demand for dollars. Such claims create the impression that there is a pile of gold or dollars somewhere that nobody wants or owns, because current demand has already been fully satisfied by the rest of the supply. The reality is that all gold and all dollars are always held/owned by someone, with the price (or purchasing power) adjusting to keep the supply equal to the demand.

From a supply-demand perspective, the only significant difference between gold and the US$ is that the supply of dollars regularly changes a lot (by 8% or more) from one year to the next, whereas the annual rate of change in the total aboveground gold supply is always around 1.6%. The reason, of course, is that considerable real resources (labour, materials and energy) must be employed to increase the aboveground gold supply, whereas the supply of dollars can be increased at no cost at the whim of central and commercial bankers.

That’s why I care about changes in US$ supply and do not care about changes in gold-mine production.

Print This Post Print This Post

Gold and ‘real’ US interest rates

[This blog post is an excerpt from a commentary published at speculative-investor.com on 27th August 2023]

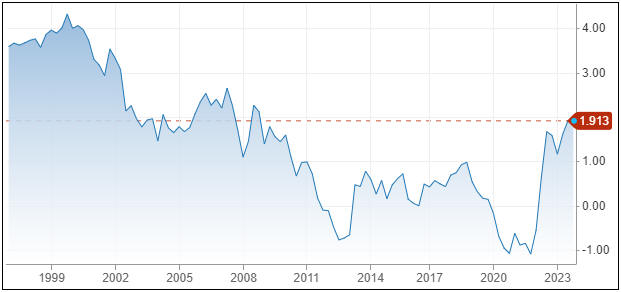
We’ve noted in previous commentaries how well the US$ gold price has held up given the rise in real US interest rates as indicated by the 10-year Treasury Inflation Protected Securities (TIPS) yield. We are referring to the fact that the 10-year TIPS yield, a long-term chart of which is displayed below, made a 14-year high of 2.00% early last week before pulling back a little, whereas the US$ gold price has retraced less than half of its up-move from its Q4-2022 low. We often say that everything is linked, and in this case the likely linkage (the explanation for gold’s resilience) is the nature of the recent T-Bond sell-off.


Chart Source: https://www.cnbc.com/quotes/US10YTIP

As discussed in last week’s Interim Update, meaningful declines in the T-Bond price over the past few decades generally have been driven by rising inflation expectations and/or the Fed’s rate-hiking. They generally have NOT been driven by accelerating supply growth or concerns about the same. The main reason is that in the past the T-Bond supply tended to ramp up in parallel with economic and financial market conditions that prompted a substantial increase in the desire to hold T-Bonds, so much so that the increase in demand for the perceived safety provided by Treasury debt trumped the increase in the supply of this debt.

The recent past has been different, in that the decline in the T-Bond price over the past four months and especially over the past month was not driven by changing expectations regarding inflation or the Fed’s monetary tightening. We know that this is the case because the “inflation” rates factored into the TIPS market (what we sometimes refer to as the “expected CPI”) have been stable, as were the prices of the most relevant Fed Funds Futures contracts prior to the past few days. Instead, the main driver was concerns about the pace at which the supply of government debt will grow over the coming year due to current spending plans, rapidly rising interest expense, and a likely large increase in government deficit-spending after the economy slides into recession. This difference matters to the gold market.

The recent increase in the ‘real’ yield on Treasury bonds has not been as bearish for gold as it normally would be, because the concerns about the US fiscal situation that have been driving the T-Bond price downward and the real T-Bond yield upward also have been boosting the investment demand for gold. We suspect that this is not so much due to the rapid increase in the government’s indebtedness in and of itself, but due to the eventual economic and monetary consequences of the burgeoning government debt.

The eventual economic consequences include slower growth as more resources get used and allocated by the government. A likely monetary consequence is that regardless of what senior members of the Fed currently say and think (they naturally will insist that the Fed is independent), there’s a high probability that the Fed eventually will be called upon to help finance the government.

Print This Post Print This Post

The status of gold’s “true fundamentals”

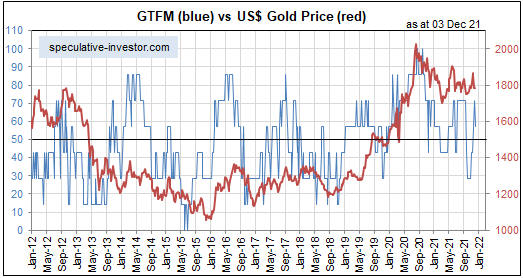
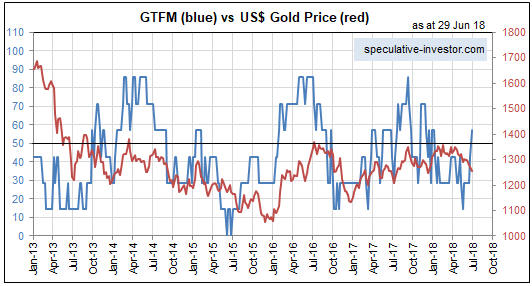
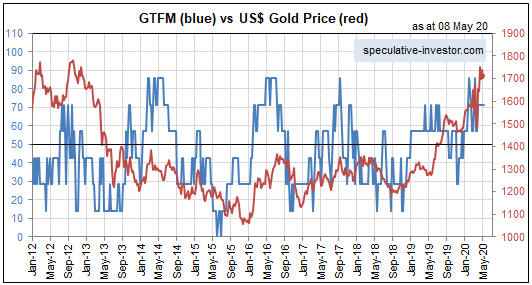
According to my Gold True Fundamentals Model (GTFM), the gold market’s fundamentals were bullish or trending positively from early-November of 2019 through to late-September of 2020 and were bearish or trending negatively from early-October of 2020 through to late-October of this year. As illustrated by the blue line on the following weekly chart, they turned upward in early-November and are now in bullish territory, albeit only slightly. Does the recent upturn constitute a major shift or a countertrend move within an overall environment that remains bearish for gold?

Before attempting to answer the above question, it is worth reiterating that I use the term “true fundamentals” to distinguish the fundamentals that actually matter from the largely irrelevant issues that many gold-market analysts and commentators focus on.

According to many pontificators on the gold market, gold’s fundamentals include the volume of metal flowing into the inventories of gold ETFs, China’s gold imports, the amount of “registered” gold at the Comex, India’s monsoon and wedding seasons, jewellery demand, the amount of gold being bought/sold by various central banks, changes in mine production and scrap supply, changes in the money supply and the CPI, and wild guesses regarding the activities of bullion banks. These things are distractions at best. For example, a gold investor/trader could have ignored everything that has been written over the past 20 years about the amount of gold in Comex warehouses and been none the worse for it.

On an intermediate-term (3-18 month) basis, there is a strong tendency for the US$ gold price to trend in the opposite direction to confidence in the US financial system and economy. That’s why most of the seven inputs to my GTFM are measures of confidence. Two examples are credit spreads and the relative strength of the banking sector. The model is useful, in that over the past two decades all intermediate-term upward trends in the gold price occurred while the GTFM was bullish most of the time and all intermediate-term downward trends in the gold price occurred while the GTFM was bearish most of the time.

However, upward corrections can occur in the face of bearish fundamentals and downward corrections can occur in the face of bullish fundamentals. For example, there was a substantial downward correction in the gold market in March of 2020 in the face of bullish fundamentals. Such corrections often are signalled by sentiment indicators.

Getting back to the question posed in this post’s opening paragraph, I suspect that we are dealing with a countertrend bullish move within an overall environment that remains bearish for gold. The reason is that although a couple of small cracks have appeared in the superficially-positive economic picture over the past few weeks, the preponderance of evidence still indicates that the US economic boom (monetary-inflation-fuelled increase in economic activity) is intact.

Major gold rallies occur during the economic bust and boom-to-bust transition phases of the long-term cycle. By the same token, gold tends to fare poorly, especially relative to the broad stock market and industrial commodities, during the boom phases of the long-term cycle. While the boom remains intact, the best that can be reasonably expected from gold is a multi-month rebound within a trading range or a long-term downward trend.

Print This Post Print This Post

Gold and the Boom-Bust Cycle

[This blog post is a modified excerpt from a commentary published at TSI on 21st February]

The true fundamentals* have been trending in a gold-bearish direction since early-October of last year, which is a large part of the reason that the gold price has been in a downward trend for the past several months. The majority of these true fundamentals are measures of confidence in the economy and/or the banking system, the theory — which is supported by decades of empirical evidence — being that gold performs relatively well in the bust phase of the boom-bust cycle and relatively poorly in the cycle’s boom phase.

Just to be clear, if the US$ is weak enough then it certainly is possible to make gains in US$ terms via being long gold during a boom, but you will do better by being long other things including industrial commodities. Hence the use, above, of the word “relatively”.

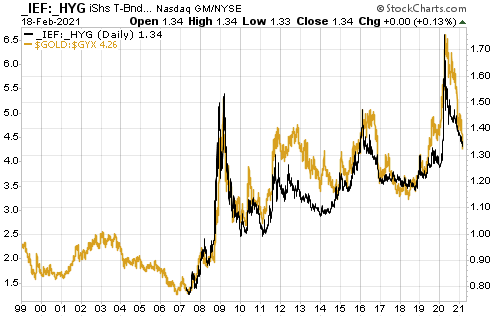
Credit spreads are one useful measure of economic confidence, with widening spreads indicating falling confidence and narrowing spreads indicating rising confidence. This implies that the direction and level of credit spreads indicate whether the economy is in the boom phase or the bust phase. That’s why the gold/commodity ratio generally has trended up and down with credit spreads, which is exactly what it should do.

Below is a chart that illustrates the relationship mentioned above. In this case metals are being compared with metals by looking at how gold performed relative to industrial metals (represented by the Industrial Metals Index – GYX) during periods of widening and narrowing credit spreads.

Unfortunately, the data for the credit spread indicator used in this chart starts in 2007, so for the first eight years of the chart there is only the gold/GYX ratio. However, a longer-term credit-spread indicator would confirm that gold/GYX’s 2001-2002 upward trend coincided with an economic bust and gold/GYX’s 2003-2006 downward trend coincided with an economic boom.

The chart suggests that there was a major economic boom during 2003-2006 and major economic busts spanning mid-2007 to mid-2009 and Q4-2018 to March-2020. The period from mid-2009 through to Q3-2018 contained a series a relatively minor booms and busts.

My guess is that the current boom will be short by historical standards, but there is no need to guess correctly because real-time data will provide timely warnings that the transition from boom to bust has begun. Right now there is no evidence that the boom is over.

*I use the term “true fundamentals” to distinguish the actual fundamental drivers of the gold price from the drivers that are regularly cited by gold-market analysts and commentators. According to many pontificators on the gold market, gold’s fundamentals include the volume of metal flowing into and out of the inventories of gold ETFs, China’s gold imports, the volume of gold being transferred out of the Shanghai Futures Exchange inventory, the amount of “registered” gold at the COMEX, India’s monsoon and wedding seasons, jewellery demand, the amount of gold being bought/sold by various central banks, changes in mine production and scrap supply, and various manipulation stories including wild guesses regarding JP Morgan’s exposure to gold. These aren’t true fundamental price drivers. They are distractions (at best) and should be ignored.

Print This Post Print This Post

Gold versus Bitcoin

[This blog post is an excerpt from a TSI commentary published last week]

Does the rapid rise in the bitcoin price and the slide in the gold price over the past several months indicate that bitcoin is sapping demand from gold? The short answer is no, because the performance of gold makes sense without reference to bitcoin. A longer answer requires discussing the major differences between gold and bitcoin.

The differences between gold and bitcoin are far more significant than any similarities. Neither is money in the only practical definition of the term (the general medium of exchange), but gold trades like money. Of particular relevance, the demand to hold money (and therefore gold) tends to rise during ‘busts’ and fall during ‘booms’. A consequence is that gold generally doesn’t do well when the stock market is ‘bubbling’.

Bitcoin, in contrast, trades like an illiquid commodity, because that’s what it is. No money or widely-used currency in history has ever traded the way bitcoin has traded and it’s reasonable to assume that none ever will.

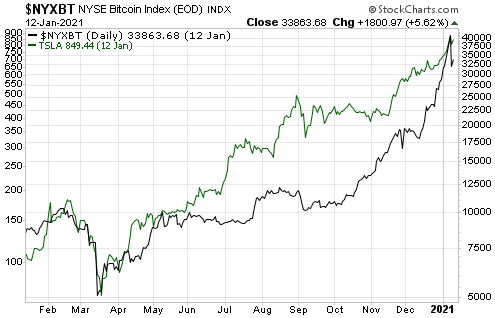
The spectacular rise in the bitcoin price over the past 10 months is related to the bubble that has formed in the stock market and the associated spectacular rises in the stock prices of the companies with which the public has become infatuated. Obviously, Tesla (TSLA) is such a company. The following chart compares the bitcoin price with the Tesla share price.

gold_bitcoin_190121

Bitcoin ‘bubbled with the stock market in 2020. It also ‘bubbled’ with the stock market during 2017 and if it had been around at the time it almost certainly would have ‘bubbled’ with the stock market during 1999-2000, whereas the desire to hold money or gold diminishes when the prices of speculative assets are rocketing upward in real terms. Who wants to own gold when the record of the past 1 year, 5 years and 10 years ‘proves’ that you will do much better by owning QQQ (the NASDAQ100 ETF)?

It’s likely that the gold price will embark on its next intermediate-term advance at around the time that the bitcoin price reaches an important top. That’s not because bitcoin has been draining demand from gold, but because a top for the bitcoin price probably will occur at around the same time as a top for speculation in general and a trough in the desire to hold cash reserves.

We still could be a few months away from a major top for speculation in general, so at this time it is still better to be ‘long’ consumable commodities and speculative assets than to be ‘long’ gold.

Print This Post Print This Post

Gold mining stocks are trades, not investments

[This post is an excerpt from a commentary posted at TSI last month]

Gold mining is — to use technical jargon — a crappy business. It doesn’t have to be, it just works out that way due to irresistible incentives associated with the post-1970 monetary system. We explained why in TSI commentaries and some articles at the TSI Blog (for example, HERE) during 2014-2015.

The explanation revolves around the boom-bust cycle caused by the monetary machinations of the banking establishment (the central bank and the commercial banks). For the economy as a whole, malinvestment occurs during the boom phase of the cycle and the bust phase is when the proverbial chickens come home to roost (the investing mistakes are recognised and a general liquidation occurs). For the gold mining industry, however, the malinvestment occurs during the economy’s bust phase, because the boom for gold mining coincides with the bust for the broad economy.

To further explain, rapid monetary inflation distorts relative price signals and in doing so incentivises investments that for a while (usually at least a few years) create the impression that the economy is powering ahead. Eventually, however, many of these investments are revealed for what they are (ill-conceived), with the revelation stemming from rising costs, declining profits or the absence of profit, resource shortages within the economic sectors that ‘boomed’ the most, and rising short-term interest rates due to a scramble for financing to complete projects and/or deal with cash flow problems.

After it starts to become clear that many of the boom-time investments were based on unrealistic expectations, a general drive to become more liquid gets underway. Many people sell whatever they can in an effort to pay expenses and service debts, thus kicking off an economic bust (recession or depression).

For the average person, becoming more ‘liquid’ usually involves obtaining more cash. However, corporations and high-net-worth individuals often prefer other forms of ‘liquidity’, including Treasury Bills and gold. That, in essence, is why the demand for gold tends to rise during the bust phase of the economy-wide boom-bust cycle.

The rising demand for gold pushes up gold’s price relative to the prices of most other assets and commodities, which elevates the general interest in gold mining. Eventually there will be a flood of money towards the gold mining industry that boosts valuations and that the managers of gold mining companies will use for something. That something will be project developments or acquisitions.

Regardless of how high market valuations move or how costly new mine developments become, gold-mining company managers will never say: “We don’t want your money because there currently are no acquisitions or new projects that make economic sense.” Instead, they will take the money and put it to work, based on the assumption that current price trends can be extrapolated into the distant future. The result invariably will be an artificial boom in the gold mining industry characterised by a cluster of high-cost investments that eventually get revealed as ill-conceived. Massive write-offs and an industry-wide retrenchment will ensue as surely as night follows day, thus obliterating the wealth created by the industry during the boom.

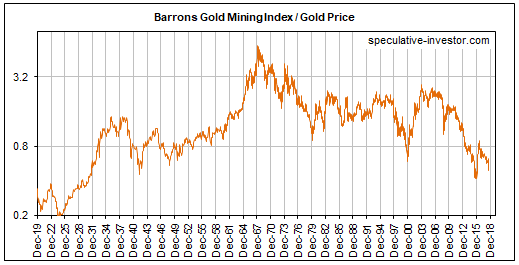
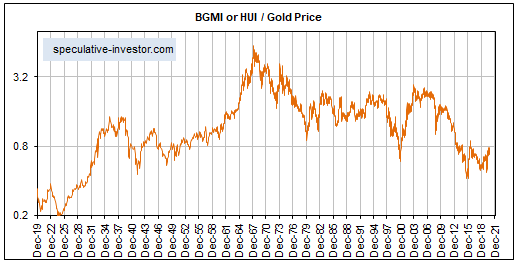
Gold itself is not made less valuable by the monetary-inflation-caused inefficiencies and widespread wastage that periodically beset the gold-mining industry. That’s why the gold mining sector, as represented on the following weekly chart by the Barrons Gold Mining Index prior to 1995 and the HUI thereafter, has been in a downward trend relative to gold bullion since 1968. That’s right — gold mining stocks, as a group, have been trending downwards relative to gold for more than 50 years!

BGMI_gold_291220

The trend illustrated by the above chart is a function of the current monetary system and won’t end before the current system is replaced. The trend could end within the next ten years, but it didn’t end in 2020 and almost certainly won’t end in 2021 or 2022. An implication is that if you want to make a long-term investment in gold, then buy gold. Gold mining stocks are for trading.

Print This Post Print This Post

Permanent shifts in gold ratios

[This blog post is an excerpt from a TSI commentary published on 19th July]

Sometimes, financial market relationships that have applied for a very long time stop working. This usually happens because the monetary system undergoes a major change or because the economy is altered in a permanent way by government and/or central bank intervention. It also can happen due to a major technological change that, for example, permanently reduces the demand for a commodity.

As a result of increasing central bank manipulation of money and interest rates, for the past 12 years gold has been getting more expensive relative to commodities that are consumed*. This is because the manipulation has been a) making it more difficult to earn a satisfactory return on investment and b) reducing the appeal of saving in terms of the official money. As central banks reduce the returns available from investing in productive enterprises and punish anyone who chooses to save cash, the demand for a store of value that central banks can’t depreciate naturally rises.

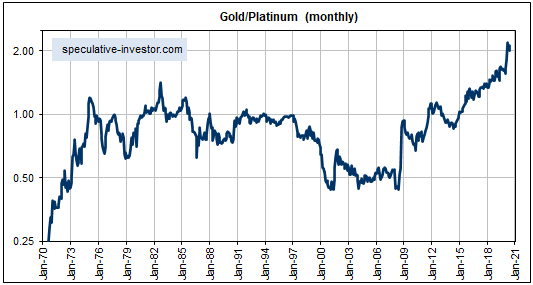
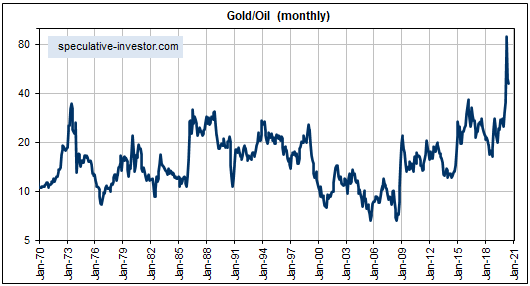
A knock-on effect is that some gold/commodity ratios appear to have been permanently elevated to higher ranges. There still will be periods when gold falls in value relative to these commodities, but the former ceilings no longer apply. In fact, in some cases it may be appropriate to view the former ceilings as the new floors. The two long-term monthly charts displayed below are cases in point.

The first chart shows the gold/platinum ratio. From the early-1970s through to 2015, gold was always near a long-term peak relative to platinum whenever the ratio moved up to 1. However, in 2015 the ratio broke above 1 and continued to trend upward.

A few years ago we speculated that gold/platinum’s former ceiling near 1 had become the new floor, that is, that the gold price would never again make a sustained move below the platinum price. The probability that this is so has since increased, although it’s likely that gold/platinum made an important high in March-2020 and is in the early stages of a 1-2 year decline.

The second chart shows the gold/oil ratio. From 1970 through to the start of 2020, gold was always near a long-term peak relative to oil whenever the ratio moved up to 30. However, during March-April of this year the gold/oil ratio reached a multiple of its previous long-term peak.

As is the situation with the gold/platinum ratio, it’s likely that the gold/oil ratio is in the process of establishing a higher long-term range that involves the former ceiling (30) being the new floor. As is also the situation with the gold/platinum ratio, it’s a good bet that the gold/oil ratio made an important high in April-2020 and is in the early stages of a 1-2 year decline.

It could be a similar story for the gold/silver ratio, although to a lesser degree. It’s likely that the gold/silver ratio has been permanently elevated, but not to the extent where the former ceiling (80-100) is the new floor. Our guess is gold/silver’s new floor is 50-60.

*That’s right, central banks are inadvertently manipulating the gold price upward, not deliberately manipulating it downward.

Print This Post Print This Post

The status of gold’s “true fundamentals”

According to my Gold True Fundamentals Model (GTFM), the gold market’s “true fundamentals” most recently shifted from bearish to bullish in December of last year. As indicated on the following weekly chart by the blue line being above 50, at the end of last week they were still bullish. This means that the fundamental backdrop is still applying upward pressure to the gold price.

GTFM_120520

As previously explained, I use the term “true fundamentals” to distinguish the fundamentals that actually matter from the largely irrelevant issues that many gold-market analysts and commentators focus on.

According to many pontificators on the gold market, gold’s fundamentals include the volume of metal flowing into the inventories of gold ETFs, China’s gold imports, the amount of “registered” gold at the Comex, India’s monsoon and wedding seasons, jewellery demand, the amount of gold being bought/sold by various central banks, changes in mine production and scrap supply, and wild guesses regarding JP Morgan’s exposure to gold. These things are distractions at best. For example, a gold investor/trader could have ignored everything that has been written over the past 20 years about the amount of gold in Comex warehouses and been none the worse for it.

On an intermediate-term (3-12 month) basis, there is a strong tendency for the US$ gold price to trend in the opposite direction to confidence in the US financial system and economy. That’s why most of the seven inputs to my GTFM are measures of confidence. Two examples are credit spreads and the relative strength of the banking sector. The model is useful, in that over the past two decades all intermediate-term upward trends in the gold price occurred while the GTFM was bullish most of the time and all intermediate-term downward trends in the gold price occurred while the GTFM was bearish most of the time.

However, upward corrections can occur in the face of bearish fundamentals and downward corrections can occur in the face of bullish fundamentals. For example, there was a sizable downward correction in the gold market in March of this year in the face of bullish fundamentals. Such corrections often are signalled by sentiment indicators.

Right now, the fundamentals are supportive while sentiment is warning of short-term downside risk.

As long as the fundamentals remains supportive, any short-term decline in the gold price should be ‘corrective’, that is, it should be within the context of a multi-year upward trend.

Print This Post Print This Post

Gold and Inflation Expectations Revisited

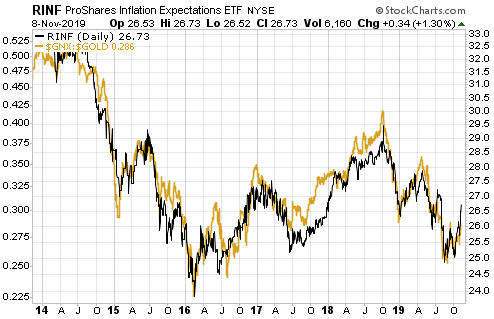
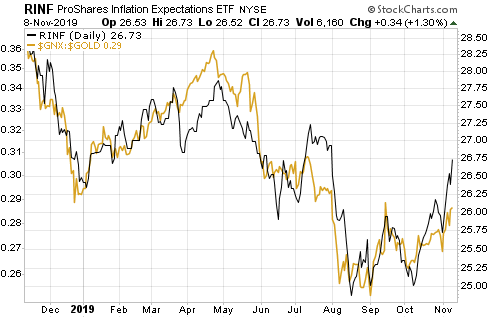
In an earlier blog post I discussed the relationship between gold and inflation expectations. Contrary to popular opinion, gold tends to perform relatively poorly when inflation expectations are rising and relatively well when inflation expectations are falling.

The relationship outlined above is very clear on the following charts. The first chart shows that over the past 6 years there has been a strong positive correlation between RINF, an ETF designed to move in the same direction as the expected CPI, and the commodity/gold ratio (the S&P Spot Commodity Index divided by the US$ gold price). In other words, it shows that a broad basket of commodities has outperformed gold during periods when inflation expectations were rising and underperformed gold during periods when inflation expectations were falling. The second chart shows the same comparison over the past 12 months. Notice that inflation expectations bottomed for the year (to date) in mid-August and the commodity/gold ratio bottomed about two weeks later.

GNXgold_IE_6Y_111119

GNXgold_IE_1Y_111119

A large part of the reason for the strong inverse relationship between gold’s relative strength and inflation expectations is the general view that “inflation” of 2%-3% is not just normal, it is beneficial. In fact, most people have been conditioned to believe that it’s a serious economic problem necessitating draconian central bank intervention if money fails to lose purchasing power at a slow and steady pace.

Eventually the rate of “price inflation” will rise to a level where it starts being seen by the public as a major economic problem, and, as a result, the desire to maintain cash savings will enter a steep decline. It is at this point that the relationship depicted above will stop working and the demand for gold will begin to surge in parallel with rising inflation expectations. In other words, at some point the relationship depicted on the above chart will reverse due to declining confidence in the official money. This point probably will arrive within the next 10 years, but probably won’t arrive within the next 12 months. Over the next 12 months it’s likely that gold will continue to be favoured during periods of falling inflation expectations and other commodities will continue to be favoured during periods of rising inflation expectations.

So, if you think that the recent inflation-expectations bounce is the start of a trend then you should be looking for opportunities to increase your exposure to commodities such as oil and copper, not gold. My guess is that inflation expectations bottomed during August-October of this year, but I’m open to the possibility that the bottoming process will extend into early next year.

Print This Post Print This Post

Gold and freight rates point to an industrial metals rally

[This post is a modified excerpt from a recent TSI commentary]

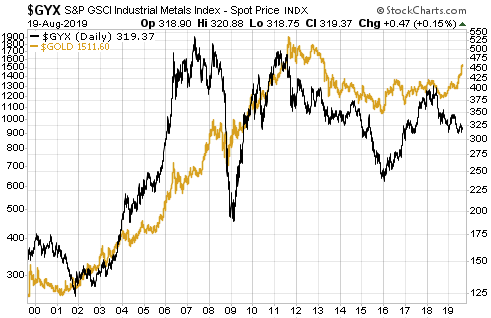
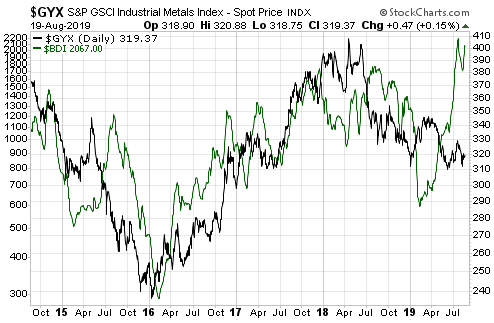
Gold tends to lead the industrial metals sector at intermediate-term bottoms, that is, the US$ gold price tends to make an intermediate-term bottom and commence a multi-quarter (or multi-year) upward trend in advance of the Industrial Metals Index (GYX). Evidence of this can be found on the following chart comparison of the US$ gold price and GYX. Specific examples are:

a) The gold price reversed upward in April of 2001 and GYX did the same in November of that year.

b) The gold price reversed upward in October-November of 2008 and GYX did the same in February-March of 2009.

c) The gold price reversed upward in December of 2015 and GYX followed suit in January of 2016.

Gold’s most recent intermediate-term bottom was in August of 2018. It has since trended upward and over the past two months the trend accelerated. GYX, however, continued to make lower lows until June of 2019. It’s too early to tell if GYX’s June-2019 low was the intermediate-term variety, but regardless of whether or not it makes a new low within the next couple of months the performance of the gold market suggests that the industrial metals sector will commence an intermediate-term rally before the end of this year.

GYX_gold_200819

The Baltic Dry Index (BDI) is also predicting an industrial metals rally

The BDI is an index of dry bulk shipping rates. I generally don’t use it as an economic or a financial-market indicator, because it is influenced as much by changes in the supply of shipping capacity as by changes in the global demand for commodities. However, intermediate-term trends in the BDI often match intermediate-term trends in the Industrial Metals Index (GYX). Also, large short-term divergences between the BDI and GYX tend to be important, with one or the other subsequently making a big catch-up move in quick time.

As illustrated by the following chart, a large divergence has opened up over the past four months due to the BDI rocketing up to a 5-year high while GYX languishes near a 2-year low. This divergence could be closed by either a dramatic plunge in the BDI or a substantial rally in the industrial metals sector. I suspect it will be the latter.

GYX_BDI_200819

Print This Post Print This Post

The “true fundamentals” are still in gold’s favour

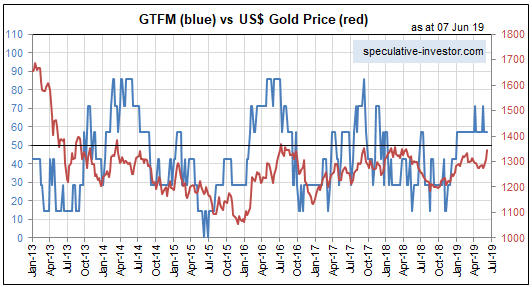
After spending almost all of 2018 in bearish territory, gold’s true fundamentals* (as indicated by my Gold True Fundamentals Model – GTFM) have spent all of this year to date in bullish territory. Refer to the following chart comparison of the GTFM (the blue line) and the US$ gold price (the red line) for the details.

GTFM_100619

A market’s true fundamentals are akin to pressure. Due to sentiment and other influences a market can move counter to the fundamentals for a while, but if the fundamentals continue to act in a certain direction then the pressure will build up until the price eventually falls into line. Also, even if it isn’t sufficient to bring about a significant rally, the upward pressure stemming from a bullish fundamental backdrop will tend to create a price floor. That’s what happened with gold during March and April.

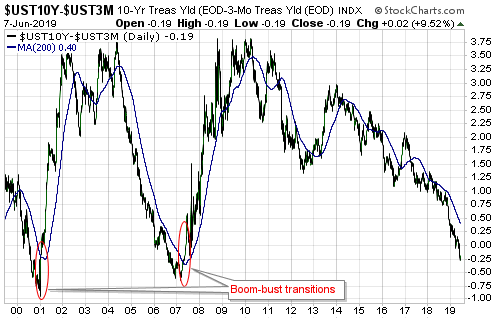
As was the case when I last addressed this topic at the TSI Blog, the most important GTFM input that is yet to turn bullish is the yield curve (as indicated by the 10year-2year and 10year-3month yield spreads). This input shifting from bearish to bullish requires a reversal in the yield curve from flattening (long-term rates falling relative to short-term rates) to steepening (long-term rates rising relative to short-term rates). If the reversal is driven primarily by falling short-term interest rates it indicates a boom-to-bust transition, such as occurred in 2000 and 2007, whereas if the reversal is driven primarily by rising long-term interest rates it points to increasing inflation expectations.

As illustrated below, at the end of last week there was no evidence of such a trend change in the 10year-3month yield spread.

yieldcurve_10y3m_100619

To get a gold bull market there probably will have to be a sustained trend reversal in the yield curve. I think that will happen during the second half of this year, but it hasn’t happened yet. Also, when it does happen my guess is that it will be driven by rising long-term interest rates (indicating rising inflation expectations), not falling short-term interest rates. That’s an out-of-consensus view right now, because inflation expectations are low/falling and almost everyone has come to the conclusion that an aggressive Fed rate-cutting campaign will get underway in the near future.

Another GTFM input that could shift from bearish to bullish in the near future and thus add to the upward pressure on the gold price is the currency exchange rate input. At the moment, all it would take to bring about this shift is a weekly close in the Dollar Index about half a point below last week’s close.

My guess is that there will be some corrective activity in the gold market over the coming 1-2 weeks, but as long as the GTFM stays in bullish territory the fundamentals-related upward pressure should enable the gold price to make new multi-year highs within the next few months.

*I use the term “true fundamentals” to distinguish the actual fundamental drivers of the gold price from the drivers that are regularly cited by gold-market analysts and commentators. According to many pontificators on the gold market, gold’s fundamentals include the volume of metal flowing into the inventories of gold ETFs, China’s gold imports, the volume of gold being transferred out of the Shanghai Futures Exchange inventory, the amount of “registered” gold at the COMEX, India’s monsoon and wedding seasons, jewellery demand, the amount of gold being bought/sold by various central banks, changes in mine production and scrap supply, and wild guesses regarding JP Morgan’s exposure to gold. These aren’t true fundamental price drivers. At best, they are distractions.

Print This Post Print This Post
What is GLD’s gold inventory telling us?

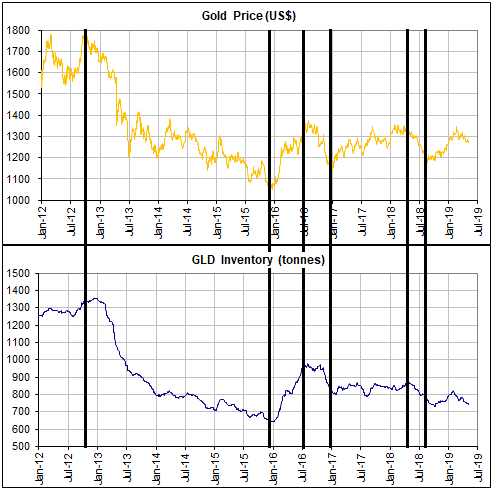
An increase in the amount of gold bullion held by GLD (the SPDR Gold Shares) and other bullion ETFs does not cause the gold price to rise. The cause-effect works the other way around and in any case the amount of gold that moves in/out of the ETFs is always trivial compared to the metal’s total trading volume. However, it is reasonable to view the change in GLD’s gold inventory as a sentiment indicator.

Ironically, an increase in the amount of physical gold held by GLD and the other gold ETFs is indicative of increasing speculative demand for “paper gold”, not physical gold. As I explained in previous blog posts (for example, HERE), physical gold only ever gets added to GLD’s inventory when the price of a GLD share (a form of “paper gold”) outperforms the price of gold bullion. It happens as a result of an arbitrage trade that has the effect of bringing GLD’s market price back into line with its net asset value (NAV). Furthermore, the greater the demand for paper claims to gold (in the form of ETF shares) relative to physical gold, the greater the quantity of physical gold that gets added to GLD’s inventory to keep the GLD price in line with its NAV.

Speculators in GLD shares and other forms of “paper gold” (most notably gold futures) tend to become increasingly optimistic as the price rises and increasingly pessimistic as the price declines. That’s the explanation for the positive correlation between the gold price and GLD’s physical gold inventory illustrated by the following chart. That’s also why intermediate-term trend reversals in the GLD gold inventory tend to follow reversals in the gold price. The thick vertical lines on the following chart mark the intermediate-term trend reversals in the US$ gold price.

GLDinventory_060519

Interestingly, the increase in the GLD inventory that occurred in parallel with the most recent upward trend in the gold price was relatively small. This suggests that the price rally was driven more by increasing demand for physical gold than by increasing demand for paper gold. Furthermore, the minor downward correction in the gold price since the February-2019 short-term peak has been accompanied by a disproportionately large decline in GLD’s physical inventory. In fact, at the end of last week GLD held about 30 tonnes less gold than it did when the gold price was bottoming in the $1170s last August. Again, this suggests that the gold price has been supported by demand for the physical metal.

In terms of influence on the gold price, speculative trading of gold futures is vastly more important than speculative trading of GLD shares. Therefore, assumptions about paper versus physical demand shouldn’t be based solely on the change in the GLD inventory. The situation in the gold futures market also must be taken into account.

I won’t get into the details in this post, but changes in futures-market positioning and open interest over the past few months are consistent with the idea that the demand for physical gold has been strong relative to the demand for paper gold.

The relatively strong demand for physical gold does not imply that a big gold-price rally is coming, but it does imply that the downside price risk is low.

Print This Post Print This Post
The fundamental backdrop remains slightly bullish for gold

I haven’t discussed gold’s true fundamentals* at the TSI Blog since early December of last year, at which time I concluded: “All things considered, for the first time in many months the true fundamentals appear to be slightly in gold’s favour. If the recent trend in the fundamental situation continues then we should see the gold price return to the $1300s early next year…” The “recent trend in the fundamental situation” did continue, enabling my Gold True Fundamentals Model (GTFM) to turn bullish at the beginning of this year (after spending almost all of 2018 in bearish territory) and paving the way for the US$ gold price to move up to the $1300s.

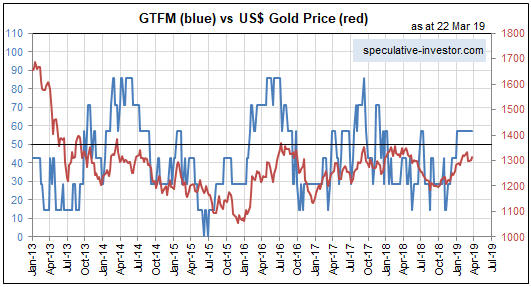
The following weekly chart shows that after moving slightly into the bullish zone (above 50) at the beginning of January, the GTFM has flat-lined (the GTFM is the blue line on the chart, the US$ gold price is the red line). Based on the current positions of the Model’s seven inputs, its next move is more likely to be further into bullish territory than a drop back into bearish territory.

As an aside, the bullish fundamental backdrop does not preclude some additional corrective activity in the near future.

GTFM_260319

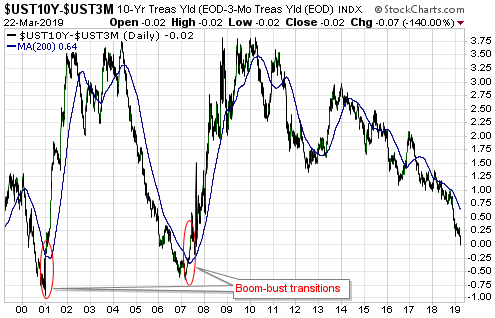
The most important GTFM input that is yet to turn bullish is the yield curve, as indicated by the 10year-2year yield spread or the 10year-3month yield spread. This input shifting from bearish to bullish requires a reversal in the yield curve from flattening (long-term rates falling relative to short-term rates) to steepening (long-term rates rising relative to short-term rates). If the reversal is driven primarily by falling short-term interest rates it indicates a boom-to-bust transition, such as occurred in 2000 and 2007, whereas if the reversal is driven primarily by rising long-term interest rates it points to increasing inflation expectations.

As illustrated below, at the end of last week there was no evidence of such a trend change in the 10year-3month yield spread.

The US$ gold price could rise to the $1400s during the second quarter of this year as part of an intermediate-term rally, but to get a gold bull market there probably will have to be a sustained trend reversal in the yield curve.

*I use the term “true fundamentals” to distinguish the actual fundamental drivers of the gold price from the drivers that are regularly cited by gold-market analysts and commentators. According to many pontificators on the gold market, gold’s fundamentals include the volume of metal flowing into the inventories of gold ETFs, China’s gold imports, the volume of gold being transferred out of the Shanghai Futures Exchange inventory, the amount of “registered” gold at the COMEX, India’s monsoon and wedding seasons, jewellery demand, the amount of gold being bought/sold by various central banks, changes in mine production and scrap supply, and wild guesses regarding JP Morgan’s exposure to gold. These aren’t true fundamental price drivers. At best, they are distractions.

Print This Post Print This Post
The fundamental backdrop turns bullish for gold…almost

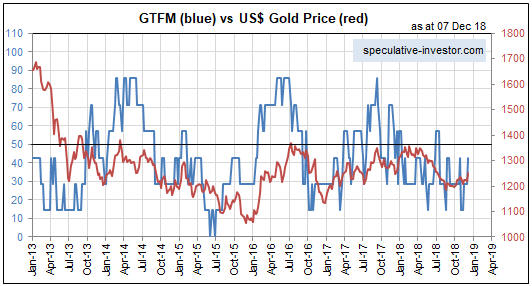
Apart from a 2-week period around the middle of the year, my Gold True Fundamentals Model (GTFM) has been bearish since mid-January 2018. There have been fluctuations along the way, but at no time since mid-January have the true fundamentals* been sustainably-supportive of the gold price. However, significant shifts occurred over the past fortnight and for the first time in quite a while the fundamental backdrop is now very close to turning gold-bullish. In fact, an argument could be made that it has already turned bullish.

Below is a chart comparing the GTFM (in blue) with the US$ gold price (in red).

The above chart understates the significance of the recent fundamental shift, because it appears that the GTFM has done no more than rise to the top of its recent range while remaining in bearish territory (which, of course, it has). However, a look beneath the surface at what’s happening to the GTFM’s seven individual components reveals some additional information.

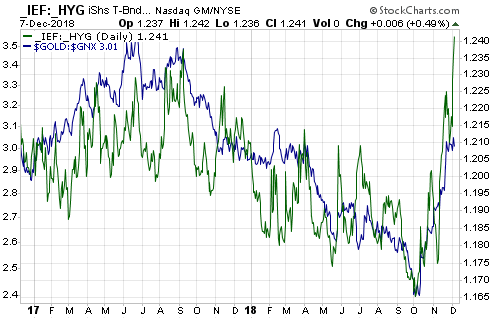
The most important piece of additional information is the recent widening of credit spreads. The credit spreads input to the GTFM turned bullish four weeks ago, but since then it has moved a lot further into bullish territory. This has improved the fundamental situation (from gold’s perspective) without affecting the GTFM calculation.

Here is a chart showing the positive correlation between a measure of US credit spreads (the green line) and the gold/GNX ratio (gold relative to commodities in general). As economic confidence declines, credit spreads widen and gold strengthens relative to other commodities.

All things considered, for the first time in many months the true fundamentals appear to be slightly in gold’s favour. If the recent trend in the fundamental situation continues then we should see the gold price return to the $1300s early next year, but, of course, that’s a big if. Furthermore, even if the fundamental backdrop continues to shift in gold’s favour over the weeks ahead it will make sense for speculators who are long gold and the related mining equities to take money off the table when sentiment and/or momentum indicators issue warnings.

*Note that I use the term “true fundamentals” to distinguish the actual fundamental drivers of the gold price from the drivers that are regularly cited by gold-market analysts and commentators. According to many pontificators on the gold market, gold’s fundamentals include the volume of metal flowing into the inventories of gold ETFs, China’s gold imports, the volume of gold being transferred out of the Shanghai Futures Exchange inventory, the amount of “registered” gold at the COMEX, India’s monsoon and wedding seasons, jewellery demand, the amount of gold being bought/sold by various central banks, changes in mine production and scrap supply, and wild guesses regarding JP Morgan’s exposure to gold. These aren’t true fundamental price drivers. At best, they are distractions.

Print This Post Print This Post
Revisiting the gold-backed Yuan fantasy

[This is an excerpt from a commentary posted at TSI about three weeks ago]

In an article titled “China’s monetary policy must change” Alasdair Macleod discusses a path that China’s government could take to make the Yuan gold-backed and thus bring about greater economic stability in China. Keith Weiner pointed out some flaws in the Macleod article, including the fact that the sort of Gold Standard that involves pegging a national currency to gold is just another government price-fixing scheme and therefore doomed to fail. We will single out an error in the article that Keith didn’t address and then briefly explain why a gold-backed Yuan is a pipe dream.

This excerpt from the article contains the error we want to focus on:

China’s manufacturing economy will be particularly hard hit by the rise in interest rates that normally triggers a credit crisis. Higher interest rates turn previous capital investments in the production of goods into malinvestments, because the profit calculations based on lower interest rates and lower input prices become invalid.

No, higher interest rates do not turn previous capital investments in the production of goods into malinvestments. A rise in interest rates can help reveal malinvestments for what they are, but it doesn’t create them.

Malinvestment occurs on a grand scale when the banking system creates a large amount of money out of nothing, generating false interest-rate signals and making it seem as if the amount of real savings in the economy is much greater than is actually the case. In response to the misleading (artificially low) interest rates and the increased future demand that these interest rates imply (more saving in the present implies more consumption in the future), investments are made in productive capacity. Many of these investments will prove to be ill-conceived, because future demand will turn out to be lower than expected. The investments only appeared to make sense due to the false impressions created by banks loaning copious quantities of new money into existence.

Another way to look at the situation is that a build-up of real savings requires a temporary reduction in consumption. Think of it as a savings-consumption trade-off. People abstain from consumption in the short term so that they will be able to consume more in the long term. When that happens on an economy-wide basis, interest rates move lower.

The falling interest rate indicates that savings are being increased and, by extension, that consumption will be higher in the future. In other words, the falling interest rate is a message that long-term investments in productive capacity are likely to pay off. The problem is that when money is created in large amounts out of nothing, interest rates tend to fall at the same time as consumption is increasing. So, entrepreneurs are being told (by the falling interest rate) that consumption will be greater in the future and to invest accordingly, but at the same time consumers are spending aggressively and ‘tapping themselves out’. Naturally, this doesn’t end well.

The crux of the matter is that malinvestment stems from artificially low interest rates. Also, once it has happened, it has happened. Rising interest rates can be part of the process via which the mistakes are revealed, but the mistakes won’t disappear if interest rates are prevented from rising. Putting it another way, it is not possible to avoid the painful consequences (economic recession or depression) that follow a period during which malinvestment was rife. This is relevant, because the Macleod article argues that interest rates could be kept low in China by linking the Yuan to gold and that by doing this the amount of existing investment that falls into the ‘mal’ category could be greatly reduced.

The reality is that regardless of what happens to interest rates in the future, the extent of the previous malinvestment is such that China’s economy will experience either a collapse or a very long period (probably at least a decade) of virtual stagnation. Given the control that the government has over the banking industry, we guess the latter.

The point is that linking the Yuan to gold wouldn’t be a way around the massive problems that are already baked into the cake. In any case this is a side issue, because there are two simpler reasons that the idea of a gold-backed Yuan is a non-starter.

The first reason is that in a world in which most international trades are US$-denominated, tying any currency apart from the US$ to gold would result in that currency’s exchange rate becoming as volatile as the US$ gold price. In fact, the exchange rate of the gold-backed currency would be totally determined by the performance of the US$ gold price. For example, if the US$ gold price were to rise by 20% in quick time then so would the exchange rate (against the US$) of the gold-backed currency.

The second and more important reason is that any government that implemented a Gold Standard would be relinquishing control of its currency. There would be no further scope for the manipulation of interest rates and currency exchange rates. Also, there no longer would be any scope for debt monetisation in particular and monetary stimulus in general. If we were to make an ordered list of the governments that are LEAST likely to give up these powers, China’s government would be at the top.

Summing up, linking the Yuan to gold would not prevent China’s economy from suffering the consequences of the widespread malinvestment of the past decade and probably would lead to much greater volatility in the prices of imports and exports. Most importantly, there is no way that the control freaks who lead the Communist Party of China are going to implement a monetary system that severely restricts their ability to intervene.

Print This Post Print This Post
The myth of gold-stock leverage

A few years ago I wrote a couple of pieces explaining why gold mining is a crappy business. The main reason is the malinvestment that periodically afflicts the industry due to the boom-bust cycle caused by monetary inflation.

To recap, when the financial/banking system appears to be in trouble and/or economic confidence is on the decline, the perceived value of equities and corporate bonds decreases and the perceived value of gold-related investments increases. However, gold to the stock and bond markets is like an ant to an elephant, so the aforementioned shift in investment demand results in far more money making its way towards the gold-mining industry than can be used efficiently. Geology exacerbates the difficulty of putting the money to work efficiently, in that gold mines typically aren’t as scalable as, for example, base-metal mines or oil-sands operations.

In the same way that the malinvestment fostered by the creation of money out of nothing causes entire economies to progress more slowly than they should or go backwards if the inflation is rapid enough, the bad investment decisions fostered by the periodic floods of money towards gold mining have made the industry inefficient. That is, just as the busts that follow the central-bank-sponsored economic booms tend to wipe out all or most of the gains made during the booms, the gold-mining industry experiences a boom-bust cycle of its own with even worse results. The difference is that the booms in gold mining roughly coincide with the busts in the broad economy.

Gold, itself, is not afflicted by the rampant malinvestment that periodically occurs within the gold-mining sector. Regardless of what’s happening in the world, an ounce of gold is always an ounce of gold. It is neither efficient nor inefficient; it just is.

A consequence is that gold bullion increases in value relative to gold-mining stocks over the long term. This is evidenced by the fact that the gold-mining sector, as represented on the following chart by the Barrons Gold Mining Index up to 1996 and the HUI thereafter, has been in a downward trend relative to gold bullion since 1968. 1968!!

Yes, we are talking about a 50-year downward trend in the value of gold-mining stocks relative to gold bullion. For how many more decades will this trend have to continue before analysts stop referring to gold-mining stocks as leveraged plays on the metal?

BGMI_gold_100918

There’s no reason to expect the above trend to end while the current monetary system is in place. This doesn’t mean that gold-mining stocks should be ignored, as these stocks can generate huge profits for traders who remember to sell when the selling is good. It means that if you want long-term exposure to gold then you should own gold, not the stocks of companies that mine gold.

Print This Post Print This Post
Gold’s true fundamentals turn bullish

I update gold’s true fundamentals* every week in commentaries and charts at the TSI web site, but my most recent blog post on the topic was on 30th April. At that time the fundamental backdrop was gold-bearish, but there has since been a change.

My Gold True Fundamentals Model (GTFM) turned bearish in mid-January 2018 and was still bearish at the end of the week before last (22nd June). There were fluctuations along the way, but at no time between mid-January and late-June was the fundamental backdrop supportive of the gold price. However, at the end of last week (29th June) the GTFM turned bullish. The deciding factor was a small, but significant, widening of credit spreads.

Here is a chart comparing the GTFM (in blue) with the US$ gold price (in red).

The upshot is that for the first time in more than 5 months the gold market has a ‘fundamental’ tail-wind, which is a prerequisite for a substantial rally. For reasons that I’ve mentioned in TSI commentaries I’m expecting a tradable 2-month rally from a July low rather than a substantial rally, but my expectations will change if the evidence changes.

*Note that I use the word “true” to distinguish the actual fundamental drivers of the gold price from the drivers that are regularly cited by gold-market analysts and commentators. According to many pontificators on the gold market, gold’s fundamentals include the volume of metal flowing into the inventories of gold ETFs, China’s gold imports, the volume of gold being transferred out of the Shanghai Futures Exchange inventory, the amount of “registered” gold at the COMEX, India’s monsoon and wedding seasons, jewellery demand, the amount of gold being bought/sold by various central banks, changes in mine production and scrap supply, and wild guesses regarding JP Morgan’s exposure to gold. These aren’t true fundamental price drivers. At best, they are distractions.

Print This Post Print This Post
Can silver rally without gold?

[This blog post is an excerpt from a recent TSI commentary]

The article titled “Silver’s Critical Role In Electrification May Fuel Its Rise” contains some interesting comments about the silver market, but with one minor exception the information presented in this article has no bearing on silver’s risk/reward as a speculation or investment. The minor exception is the high (by historical standards) gold/silver ratio, which suggests that the silver price is likely to rise relative to the gold price over the next few years. However, none of the information about silver ‘fundamentals’ presented in the article is relevant to the silver price.

It isn’t relevant for the same reasons that most of the information presented by the ‘experts’ about gold fundamentals is also not relevant: It treats the annual output of the mining sector as if it were the total supply (annual mine production is a small fraction of the total supply) and it confuses flows from one part of the market to another with changes in total demand (every ‘flow’ involves an increase in demand on the part of the buyer and an exactly offsetting decrease in demand on the part of the seller). Furthermore, it isn’t relevant for another reason that can be illuminated by asking the question: within the past 80 years, when was there a major silver rally in the absence of a gold rally?

The answer is that over the past 80 years there hasn’t been a single major silver rally in the absence of a gold rally. The best rally in silver without a concurrent rally in gold was the 6-month price spike that began in Q3-1997. This rally resulted from an attempt to manipulate the price upward on the back of Warren Buffett’s silver accumulation; it did not result from any of the ‘fundamental’ drivers cited by commentators trying to make the case that silver can rally strongly without gold.

The historical record persuasively argues that large silver rallies don’t happen in the absence of large gold rallies. This tells us that either economic/financial-system confidence drives the silver market in the same way that it drives the gold market or that the big trends in silver simply follow the big trends in gold.

The bottom line is that there does not appear to be a good reason to expect the silver price to move substantially higher independently of the gold price.

Print This Post Print This Post