The article linked HERE answers yes to the above question. The correct answer is no.
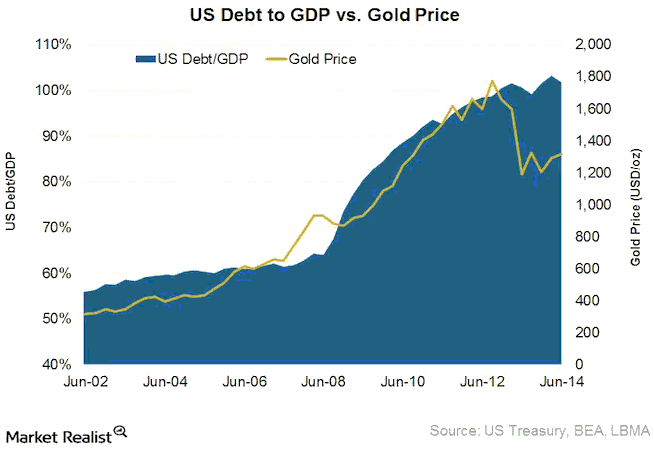
The above-linked article presents the following graph as evidence that the debt/GDP ratio (US federal government debt divided by US GDP, in this case) does, indeed, drive the US$ gold price. However, this is a classic example of cherry-picking the timescale of the data to demonstrate a relationship that isn’t apparent over other timescales. It is also a classic example of confusing correlation with causation. Many things went up in price during the 2002-2014 period covered by this graph. Should we assume that all of these price rises were caused by the increase in the US government-debt/GDP ratio?
By the way, graphs like this were far more visually appealing — although no more valid — three years ago, because the positive correlation ended in 2011. Since 2011, the debt/GDP ratio has continued its relentless advance while the gold price has trended downward. A similar graph that was popular for a while showed a strong positive correlation between the gold price and the US monetary base from the early-2000s through to 2011-2012, which created the impression that the gold price would continue to rise as long as the US monetary base continued to do the same. Again, though, this impression was the result of confusing correlation and causation.

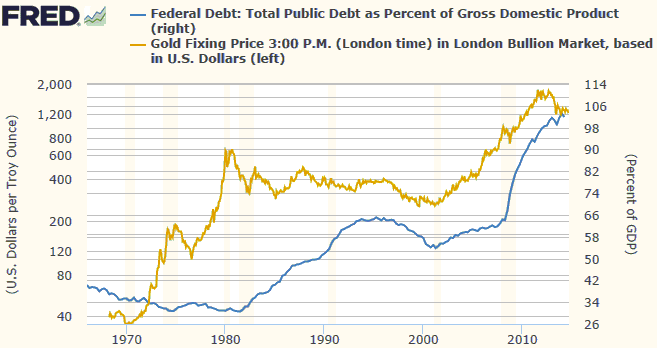
Here’s a chart showing the relationship between the gold price and the US debt/GDP ratio over a much longer period. This chart’s message is that there is no consistent relationship between these two quantities. For example, the huge gold bull market of the 1970s occurred while the debt/GDP ratio was low with a slight downward bias and actually ended at around the time that the debt/GDP ratio embarked on a major upward trend. In fact, from the early-1970s through to the mid-1990s there appeared to be an INVERSE relationship between the gold price and the debt/GDP ratio, but this is just a coincidence. It doesn’t imply that gold was hurt by a rising debt/GDP ratio and helped by a falling debt/GDP ratio; it implies that the debt/GDP ratio isn’t a primary driver of gold’s price tend. For another example, the gold price and the debt/GDP ratio rose in parallel during 2001-2006, but the rise in the debt/GDP ratio during this period was slow and was not generally considered to be a reason for concern. Therefore, it wasn’t the driver of gold’s upward trend.
The theory that the US government debt/GDP ratio is an important driver of the US$ gold price seems to be solely based on the 3-year period from late-2008 through to late-2011, when the two rocketed upward together.

The reality is that a rising US debt/GDP ratio can be a valid part of a bullish gold story, but only to the extent that it helps to bring about lower real interest rates and/or a steeper yield curve and/or a weaker US dollar and/or rising credit spreads. It isn’t directly bullish for gold, which is why a long-term comparison of the US$ gold price and the US debt/GDP ratio shows no consistent relationship. The same can be said about a rising US monetary base.
 Print This Post
