Gold’s true fundamentals are mixed, at best
Posted By Steven Saville On September 11, 2015 @ 8:00 am In Uncategorized | Comments Disabled
To paraphrase Jim Grant, gold’s perceived value in US$ terms is the reciprocal of confidence in the Fed and/or the US economy. That’s why the things I refer to as gold’s true fundamentals are measures of confidence in the Fed and/or the US economy. I’ve been covering these fundamental drivers of the gold price in TSI commentaries for about 15 years.
Note that I use the word “true” to distinguish the actual fundamental drivers of the gold price from the drivers that are regularly cited by the majority of gold-market analysts and commentators. According to many pontificators, gold’s fundamentals include the volume of gold being imported by China, the volume of gold being transferred out of the Shanghai Futures Exchange inventory, the amount of “registered” gold at the COMEX, India’s monsoon and wedding seasons, the amount of gold being bought/sold by various central banks, changes in mine production and scrap supply, and wild guesses regarding JP Morgan’s exposure to gold. These aren’t true fundamental price drivers. At best, they are distractions.
In no particular order, the gold market’s five most important fundamental drivers are the real interest rate, the yield curve, credit spreads, the relative strength of the banking sector, and the US dollar’s exchange rate.
Over the past 2 years gold’s true fundamentals have usually been mixed, meaning neither clearly bullish nor clearly bearish. What has tended to happen during this period is that when one of the fundamentals has moved decisively in one direction it has been counteracted by a move in the opposite direction by one of the others. For example, when credit spreads began to widen (gold-bullish) in mid-2014, the flattening of the yield curve (gold-bearish) accelerated. For another example, when the yield curve reversed direction and began to steepen (gold-bullish) in January of this year, the real interest rate turned upward (gold-bearish) and the banking sector began to strengthen relative to the broad stock market (gold-bearish).
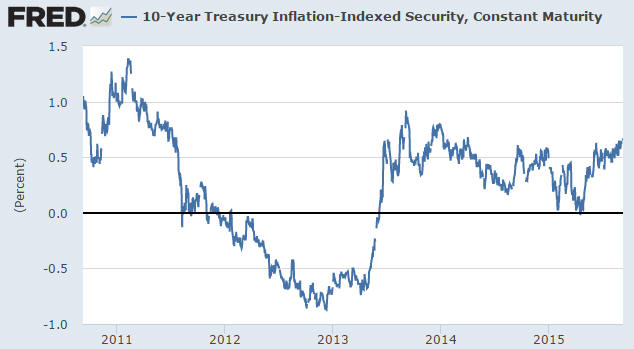
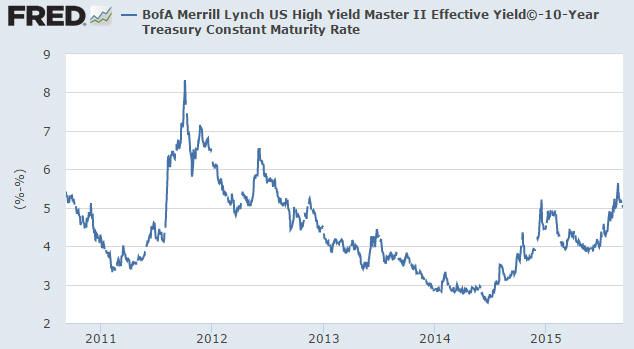
Charts illustrating the performances over the past 5 years of the first four of the above-mentioned fundamental drivers of the gold market are displayed below. The first chart shows that the 10-year TIPS yield, a proxy for the real US interest rate, made a 2-year low in April of this year but has since moved to a 1-year high and into the top third of its 2-year range. This is bearish for gold. The second chart shows that a proxy for US credit spreads has been working its way upward since mid-2014 and recently broke to a new 2-year high. This is bullish for gold. The third chart shows that the US yield curve began to steepen in January, which is bullish for gold, but its performance over the past two months casts doubt as to this driver’s current message. And the fourth chart shows that after being relatively weak from July-2013 through to January-2015, the bank sector suddenly became relatively strong early this year. This driver has therefore shifted from gold-bullish to gold-bearish.
The overall picture painted by these charts is that gold’s fundamentals are still mixed, although there is perhaps a slight bearish skew due to the new 12-month high in the real interest rate. I’m anticipating a shift towards a more gold-bullish fundamental backdrop, but it hasn’t happened yet.
 [1]
[1]
 [2]
[2]
 [3]
[3]
 [4]
[4]
Article printed from TSI Blog: https://tsi-blog.com
Click here to print.