The global boom/bust indicator
Posted By Steven Saville On September 5, 2014 @ 9:41 am In Uncategorized | Comments Disabled
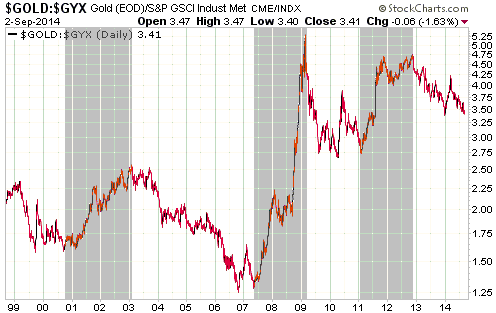
The gold market is generally weak relative to the industrial metals markets during the boom phase of the inflation-fueled, central-bank-sponsored boom/bust cycle and strong relative to the industrial metals markets during the bust phase of the cycle. In other words, the gold/GYX ratio (gold relative to the Industrial Metals Index) tends to fall during the booms, which are periods when economic confidence rises while mal-investment sets the stage for an economic contraction, and rise during the busts, which are periods when the mistakes of the past come to the fore. This is due to gold’s historical role as a store of purchasing power and a hedge against uncertainty.
By shading the bust periods in grey, I’ve indicated the global booms and busts on the following chart of the gold/GYX ratio. During the 16-year period covered by the chart there have been three busts: the recession of 2001-2002 that followed the bursting of the NASDAQ bubble, the global financial crisis and “great recession” of 2007-2009, and the euro-zone sovereign debt and banking crisis of 2011-2012.
The booms tend to fall apart more quickly than they build up, so the rising trends in the gold/GYX ratio tend to be shorter and steeper than the falling trends.

Gold/GYX’s current situation looks most similar to Q2-2007. At that time the ratio tested its late-2006 bottom and then reversed upward, marking the end of the boom that began in 2003. However, gold will soon have to start strengthening relative to industrial metals such as copper in order for the 2007 similarity to be maintained. If this doesn’t happen and the gold/GYX ratio breaks decisively below its December-2013 bottom, it will indicate that the boom is going to extend into 2015.
I want to stress that gold’s relationship to the boom/bust cycle is primarily about its performance relative to other commodities, especially the industrial metals. It is not about gold’s performance in US$ terms. For example, from mid-2005 through to mid-2006 gold performed poorly relative to the industrial metals, but this was a good time to be long gold and a very good time to be long gold stocks. It’s just that the industrial metals handily outperformed gold during this period, which makes sense considering the global economic and financial-market backdrop at the time. For another example, from May through November of 2008 gold performed extremely well relative to the industrial metals. This makes sense considering the global economic and financial-market backdrop of the period, but it was a bad time to be long gold and a very bad time to be long gold stocks.
Article printed from TSI Blog: https://tsi-blog.com
Click here to print.